Figure 8.
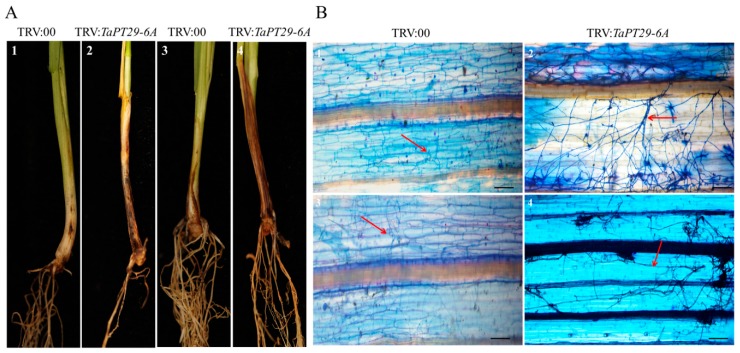
Silencing TaPT29-6A increased susceptibility to Ggt and B. sorokiniana. (A) Typical infection phenotypes of 16 days after silencing control plants and TaPT29-6A-silenced plants after inoculation with Ggt (1–2) and B. sorokiniana (3–4) for 21 days and 40 days. (B) Microscopic images of Ggt (1–2) and B. sorokiniana (3–4) hyphae on the base leaf sheaths of TaPT29-6A VIGS and TRV:00 plants. Red arrows indicate the hyphae of Ggt and B. sorokiniana pathogens. Scale bar = 25 µm.

