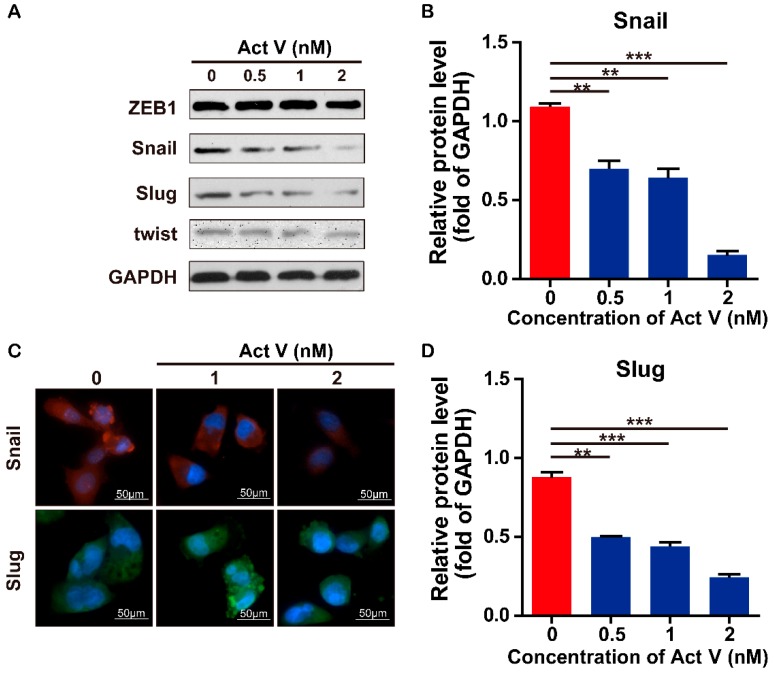
Figure 8.
Effects of actinomycin V on the expression levels of snail and slug. (A,B,D) MDA-MB-231 cells were treated with 0 to 2 nmol/L actinomycin V for 24 h then the protein expression of snail and slug was measured by Western blot. Results were obtained from three independent experiments. * p < 0.05, ** p < 0.01, *** p < 0.001. (C) cells were treated with 0 to 2 nmol/L actinomycin V for 6 h and analyzed by snail and slug fluorescent signals. Cells were stained with anti-snail (red), slug (green) and DAPI (blue). Magnification ×200. Snail and slug levels were decreased in the cells, consistent with the Western blot results.

