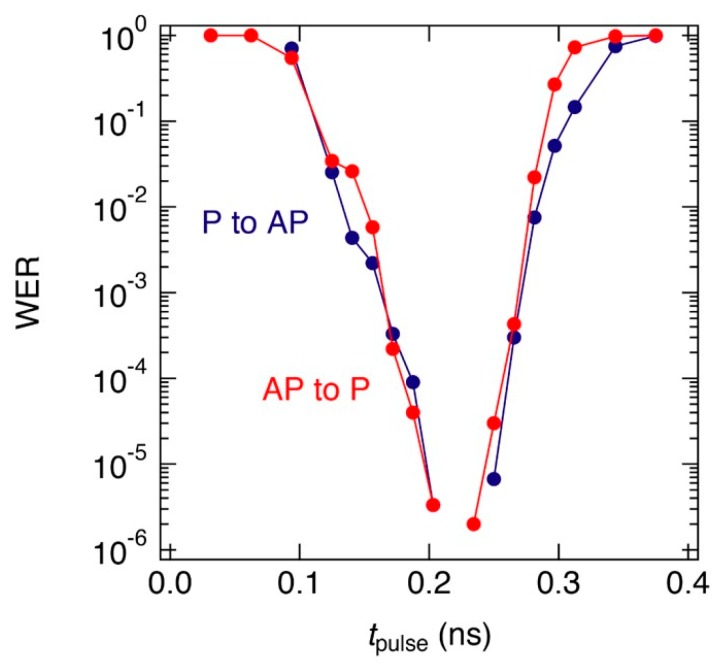
Figure 18.
Example of the optimized WER as a function of tpulse observed in a perpendicularly-magnetized MTJ consisting of Ta/(Co50Fe50)80B20/MgO/reference layer. The blue and red symbols represent the WER of parallel (P) to antiparallel (AP) and AP to P switching, respectively. Reprinted figure with permission from [109], Copyright 2019 by the IOP Publishing Ltd.

