Figure 3.
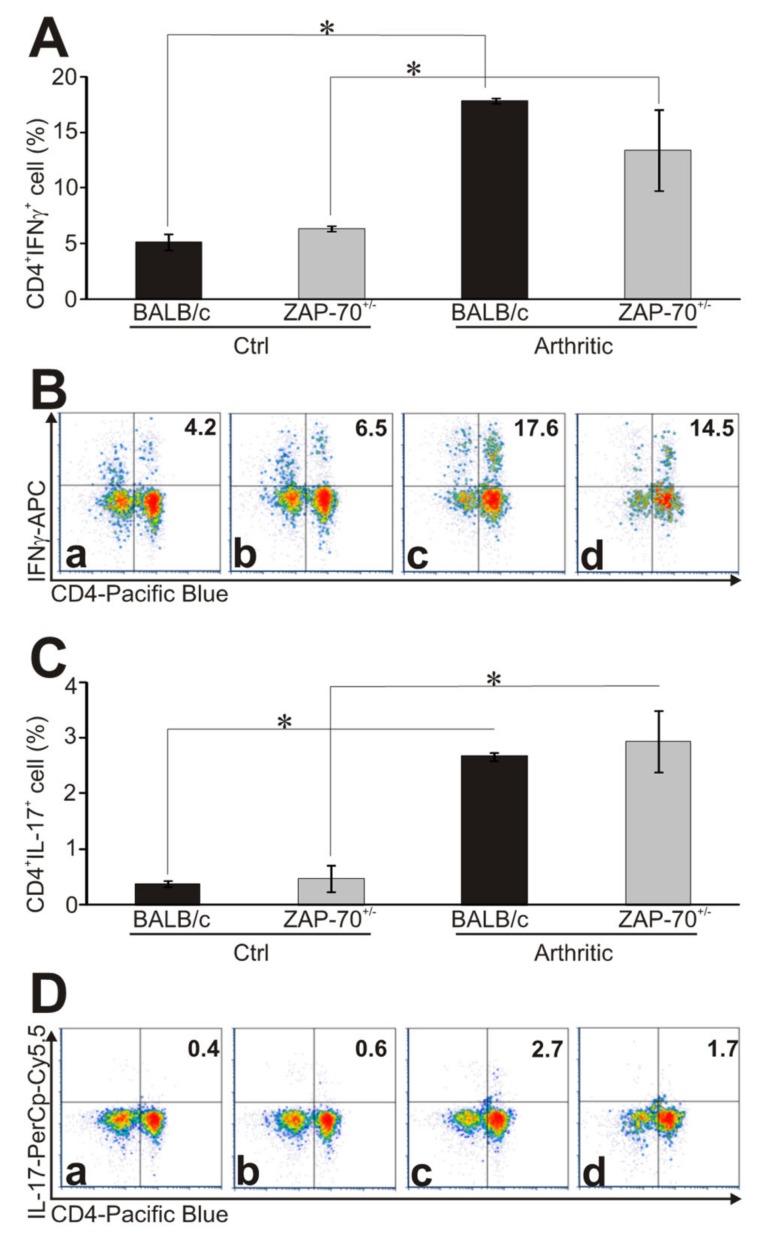
Cytokine profiles of T helper cells in healthy and arthritic mice. The ratio of cytokine-producing cells was measured from healthy and arthritic BALB/c and ZAP-70+/− spleen cells after in vitro PMA/ionomycin stimulation using intracellular staining followed by flow cytometry. Bar diagrams show the percentage of IFNγ- (A) and IL-17-producing (C) CD4+ cells. Representative density plots show the expression of CD4 and IFNγ (B) or CD4 and IL-17 (D) in healthy BALB/c (a), ZAP-70+/− (b) and arthritic BALB/c (c) and ZAP-70+/− (d) mice. Numbers in the plots show the percentages of double positive (CD4+ IL-17+ or CD4+ IFNγ+), cytokine producing T helper cells. All results shown in bar diagrams are mean values ± standard error of mean (SEM) calculated from the results of n = 3 mice in all experimental groups. Statistically significant differences are indicated (* p ≤ 0.05).

