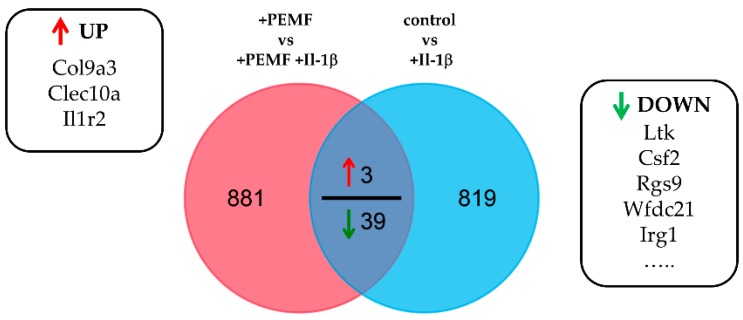
Figure 6.
Quantitative VENN diagram showing overlap of genes derived from differential expression analysis. Commonly regulated genes (≥2.0 fold change) are partially shown in the boxes. 3 of these genes were significantly up-regulated, whereas 39 genes were identified to be down-regulated (top 5 shown).

