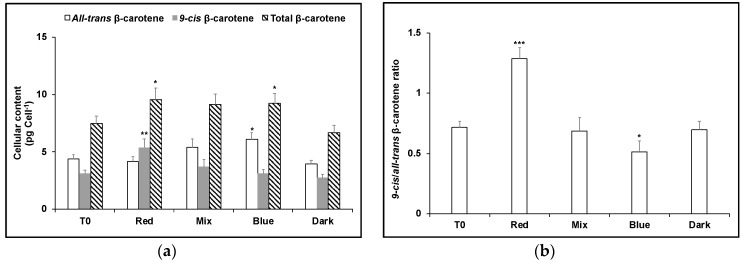
Figure 3.
(a) Cellular content of 9-cis βC and all-trans βC and (b) 9-cis/all-trans βC ratio in D. salina cultures exposed to continuous blue LED light at 1000 µmol m−2 s−1 for 24 h followed by 24 h under either red light, a mix of 1:1 red and blue light, blue light at the same light intensity of 1000 µmol m−2 s−1 or dark. Each culture condition was set up at least in triplicate. Results were analysed by one way ANOVA with posterior Dunnett’s test compared to T0 and Tukey multiple pairwise-comparisons. Asterisks represent different levels of significance (*** 0 < p ≤ 0.001, ** 0.001 < p ≤ 0.01, * 0.01 < p ≤ 0.05).

