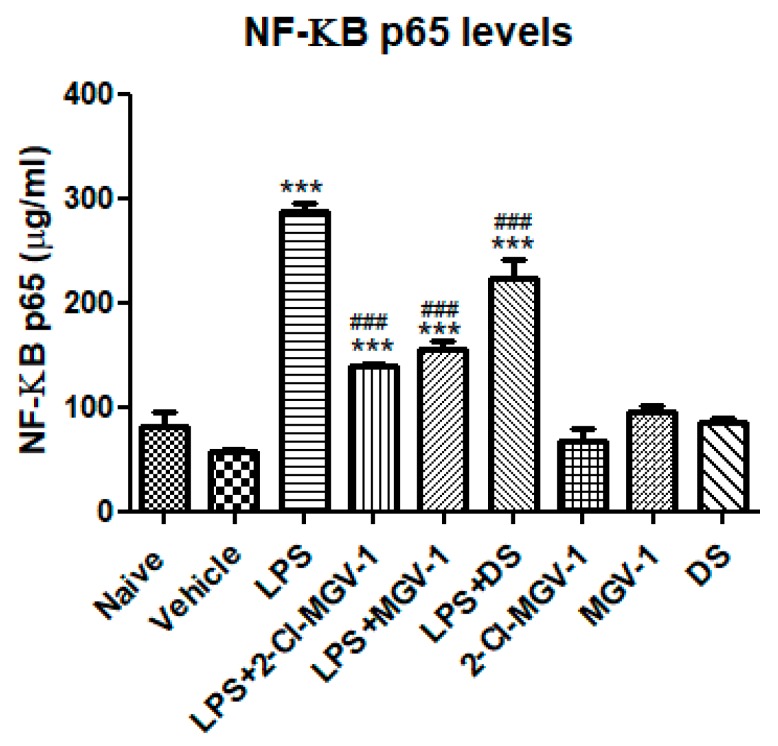
Figure 4.
Effect of the two TSPO ligands on NF-κB p65 (pS536) levels in LPS- stimulated BV-2 cells. BV-2 cells were exposed to 100 ng/mL LPS for 24 hours with or without the two TSPO ligands or DS (25 µM each). NF-κB p65 (pS536) concentrations (µg/mL) were calculated using a standard calibration curve and are presented as means ± SD; n = 4 in each group. ANOVA followed by Bonferroni’s post-hoc test was performed, and the results remained statistically significant *** compared to all other groups and ### compared to LPS (p < 0.001 for all).

