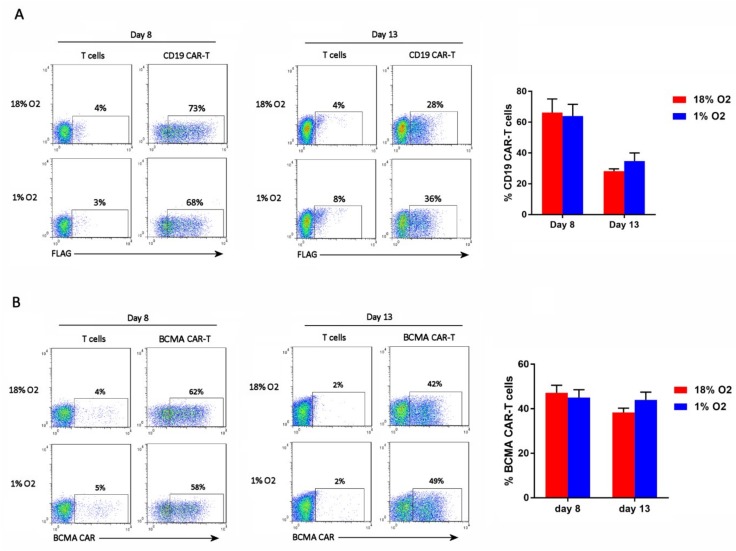
Figure 2.
Hypoxia does not affect CAR-T cell frequency. CD19 CAR-T cells (A) and BCMA CAR-T cells (B) were stained with an anti-FLAG antibody or BCMA protein, respectively. Representative flow cytometry plots showing CAR expression on the X-axis (the Y-axis is an empty channel) are on the left. Charts showing the average and standard error of 4 separate experiments are shown on the right.

