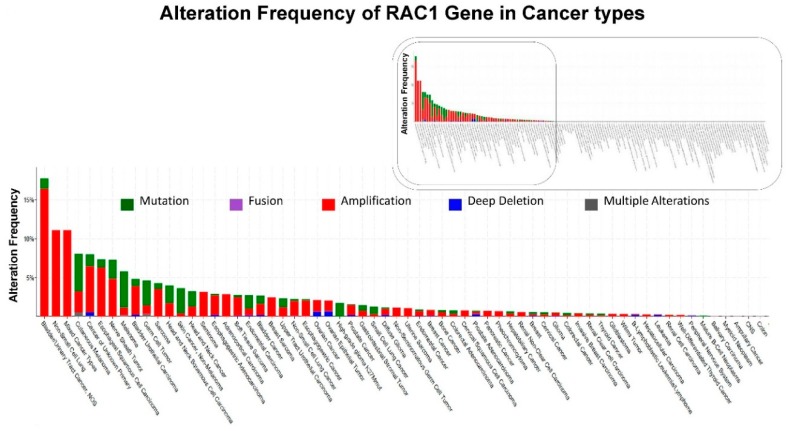
Figure 1.
Alterations of RAC1 Gene: Data has been queried from cBioPortal. Figure 1 shows the alteration frequency of RAC1 gene in different cancer types: Data obtained from c-BioPortal (January 2019) representing a combined study of 74247 samples, querying 71857 patients/74247 samples in 240 studies (http://www.cbioportal.org). Y-axis represents alteration frequency of RAC1 gene (colors represent the type of alterations as shown in the figure). The frequency of alterations is sorted on X-axis according to cancer types. Inset shows the entire distribution of the frequency of alterations of the RAC1 gene while the boxed portion of the inset represents only the cancers where the frequency of alterations occurred (boxed in the inset).

