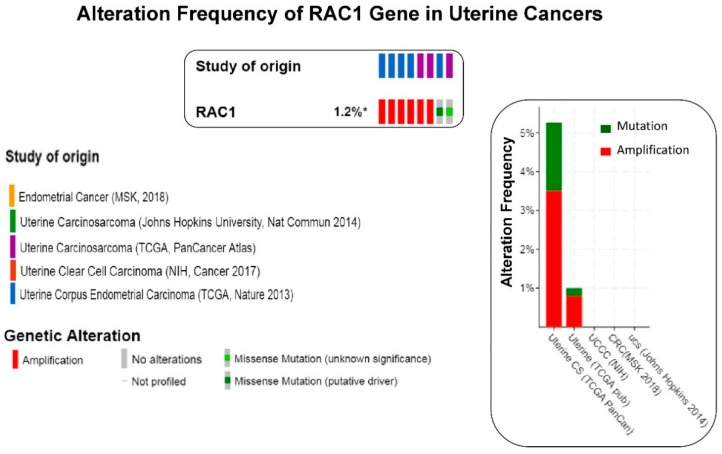
Figure 4.
The frequency of alteration of RAC1 gene in uterine cancers: The oncoprint presents data obtained from c-BioPortal (February 2019) representing a combined study of 792 samples (http://www.cbioportal.org), querying 784 patients/792 samples in five studies as shown in different color codes of the oncoprint (upper panel) under “Study of origin” in the figure. The percentage (1.2%*) represents the alteration of the RAC1 gene in patients with uterine cancers. The lower panel of the oncoprint represents the types of alterations of RAC1 gene in samples as shown under “Genetic Alteration” in the figure. Unaltered (RAC1 gene) cases were not included in the oncoprint. The bar diagram (figure on the right panel) represents the frequency of alterations in the RAC1 gene in a few individual uterine cancer studies where alteration was identified. The Y-axis of the bar diagram represents alteration frequency of the RAC1 gene (colors represent the type of alteration as shown in the figure). The frequencies of alterations are sorted on X-axis according to “Cancer Study”.

