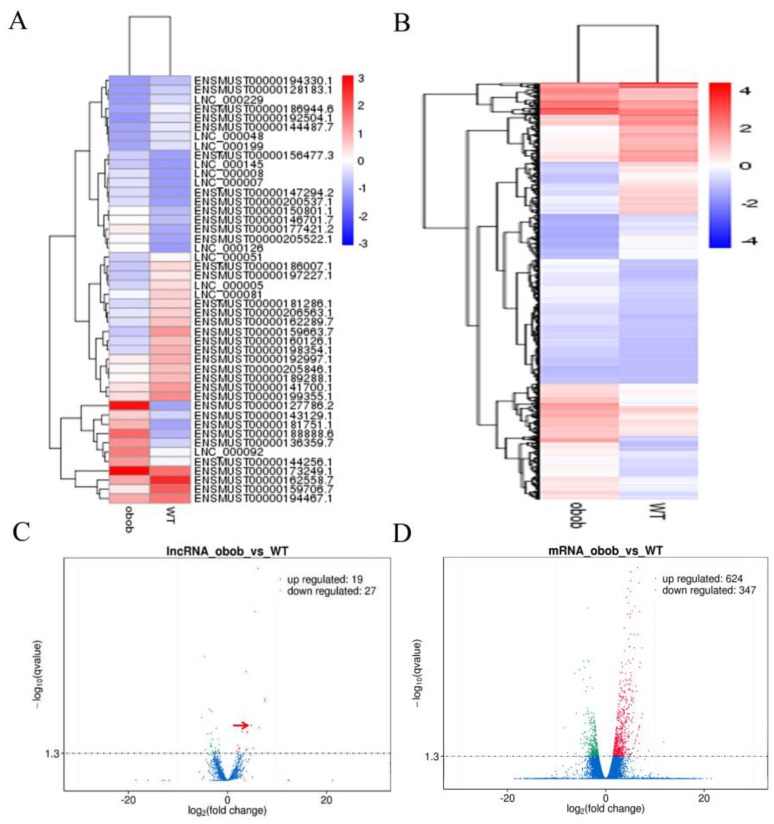
Figure 2.
Differentially expressed lncRNAs and differentially expressed genes (DEGs) in WT and ob/ob mice. (A) Heat map of the differentially expressed lncRNAs in WT and ob/ob mice (fold change ≥2 and q value ≤0.05). (B) The heat-map of the differentially expressed mRNAs in WT and ob/ob mice (fold change ≥ 2; q-value ≤ 0.05). (C) Volcano plot of differentially expressed lncRNAs. Among these lncRNAs, 19 lncRNAs were upregulated and 27 lncRNAs were downregulated in ob/ob mice. lnc-ORA was denoted by red arrow. (D) Volcano Plot of differentially expressed mRNAs. Among these mRNAs, 624 mRNAs were upregulated and 347 mRNAs were downregulated in ob/ob mice.

