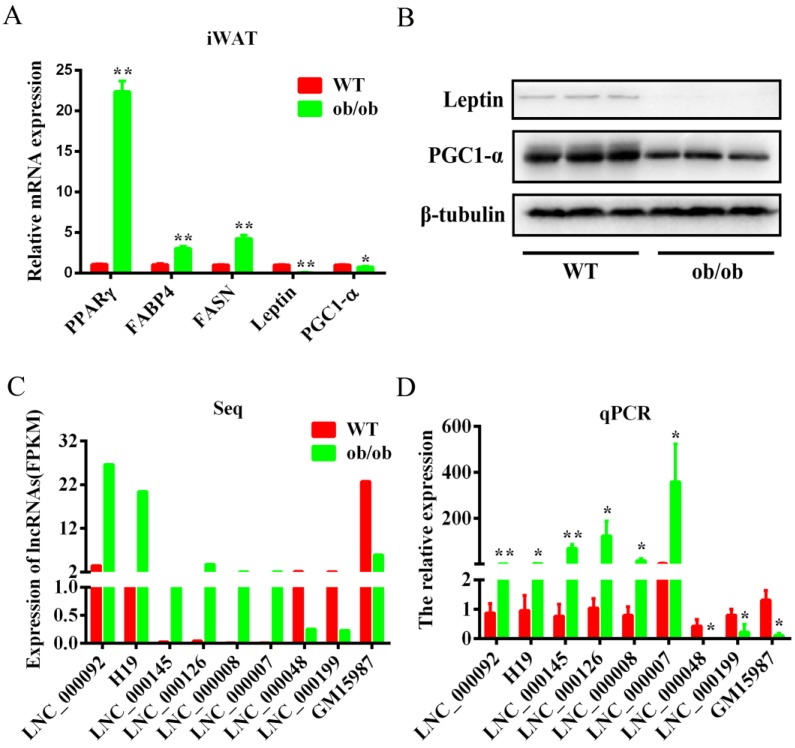
Figure 4.
Validation of the differentially expressed lncRNAs by qPCR. (A) mRNA expression levels of adipogenic marker genes in WT and ob/ob mice. (B) Protein expression levels of leptin and PGC1-a in the iWAT of WT and ob/ob mice. (C) Sequencing FPKM values of nine lncRNAs. (D) The lncRNAs were validated by qPCR assays. Data are expressed as the mean ± SEM (n = 5). * p< 0.05, ** p < 0.01.

