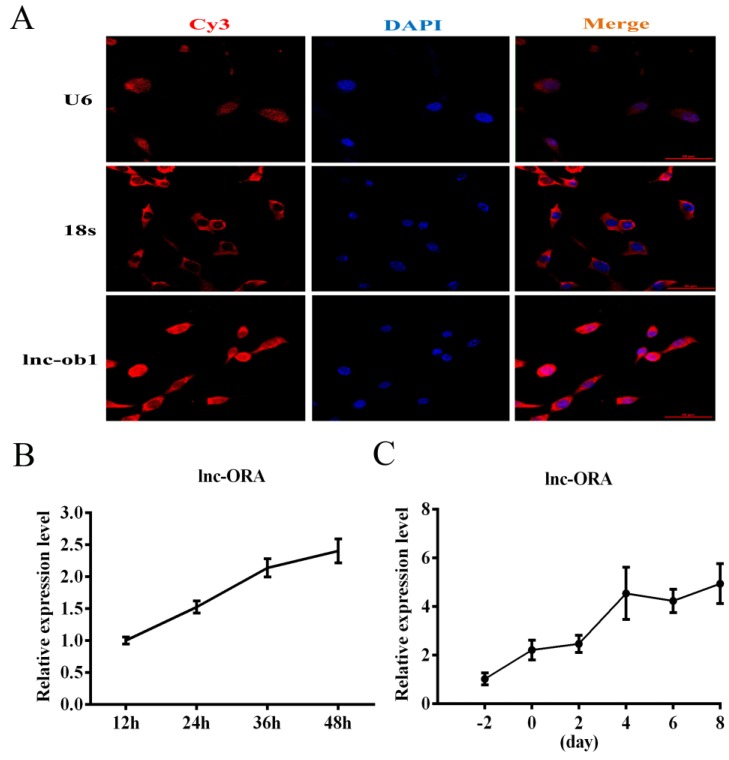
Figure 5.
Subcellular locations and expression pattern analysis of lnc-ORA. (A) Subcellular localization of lnc-ORA by fluorescent in situ hybridization (FISH) in preadipocytes. Special FISH probes against lnc-ORA, U6, and 18s were modified by Cy3 (red); 18S is a cytoplasmic marker, and U6 is a nuclear marker. The nucleus was stained by DAPI (blue). (B) Expression pattern of lnc-ORA during preadipocytes proliferation. (C) Expression levels of lnc-ORA after inducing adipocytes differentiation. Data are expressed as the mean ± SEM (n = 3).

