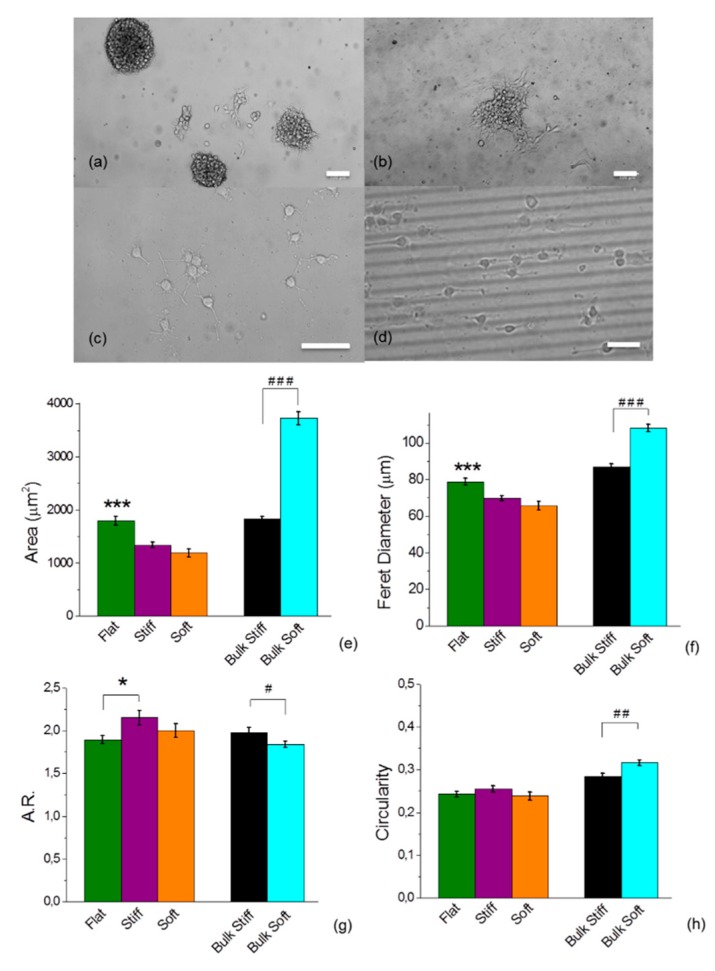
Figure 2.
Substrate stiffness’s determines the distribution and morphology of the glioma cells. (a–d) Representative bright field images of U251 on bulk stiff (a), bulk soft (b), durotactic flat (c) and durotactic lined substrate (d) under 10× magnification (scale bars 100 μm). (e–h) Cell morphology analysis of area (e), Feret’s diameter (f), aspect ratio (A.R) (g) and circularity (h) were analysed with Fiji ImageJ. The value represents mean ± standard error (S.E.M) (n = 200 cells of 4 fields for each different condition). Statistical significance indicated by * for p < 0.05, ** for p < 0.01 and *** for p < 0.0001, assessed by Tukey one-way ANOVA test. The hash tag indicates statistical significance by two-tailed Student’s t-test analysis with # for p < 0.05, ## for p < 0.01 and ### for p <0.0001.

