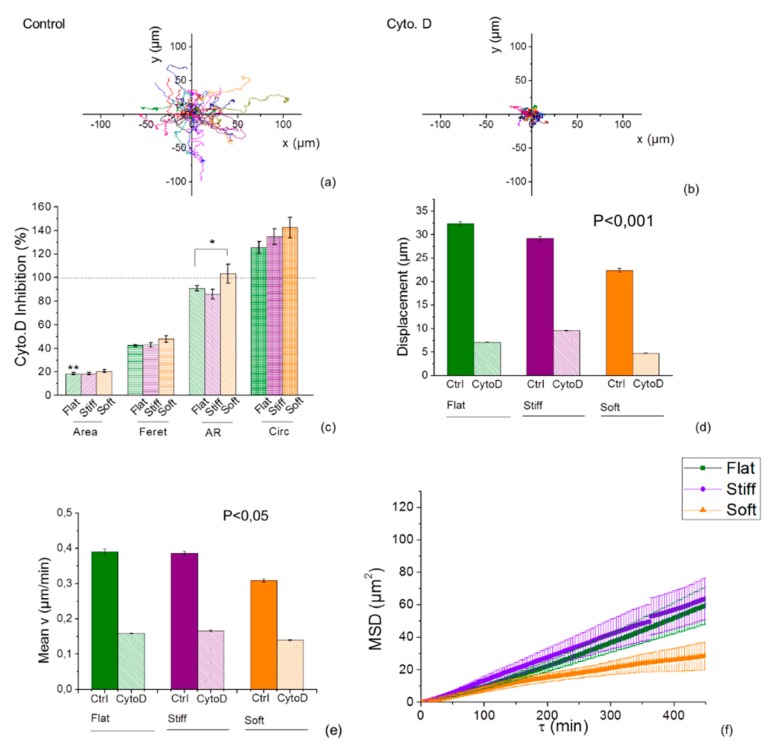
Figure 6.
Inhibition of actin polymerization with Cyto. D on U251 on durotactic substrates showed a stiffness-dependent reduced response with a higher sensitivity to stiff substrates. (a,b) Cell movement track of 35 cells from 4 fields of acquisition on flat and micropatterned durotactic substrates was analysed by ImageJ. The different colours represent different cells analysed. (c) Normalized U251 cell morphology such as cellular spread area, elongation (Feret diameter), A.R. and Circularity of cells subsequent treatment with Cyto. D, where treated cells (bars) are compared with that in control cells (dotted lines). Cell track positions were used to calculate the displacement (d), speed of migration (e) and the mean squared displacement (MSD) (f) as a function of the time lag () of U251 cells treated with Cyto. D. Statistical significance indicated by * for p < 0.05, assessed by Tukey one-way ANOVA test. Error bars indicate S.E.M.

