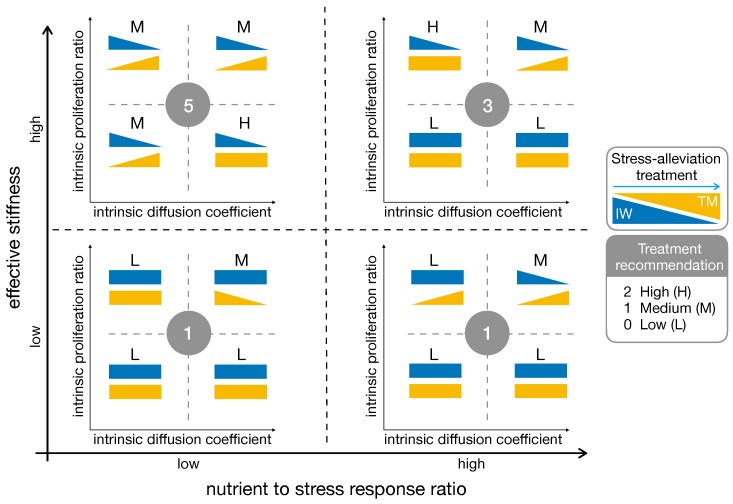
Figure 7.
Summary of model results for chemo-mechanically induced phenotypic transitions. The triangles denote an increase (or decrease) of IW (blue) or TM (yellow) when a stress-alleviation treatment is performed. Rectangles denote a scarce effect of the treatment. The graph spans different levels of cell mechanosensitivity (vertical axis) and nutrient-to-mechanical response (horizontal axis). The labels and the circled numbers are related to the treatment recommendation score (L: low; M: medium; H: high), with higher numbers identifying better treatment outcomes.

