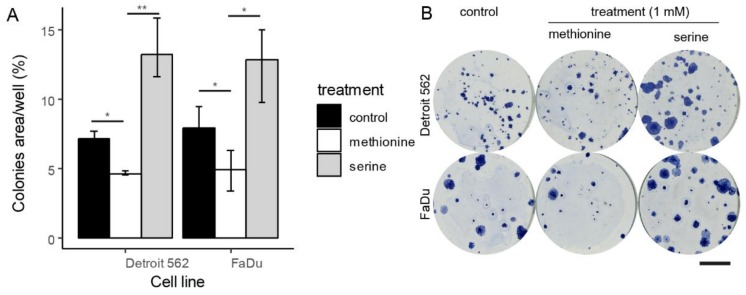
Figure 2.
Colony-forming assays, in vitro cell line experiment on head and neck squamous cell cancer (HNSCC) primary (FaDu) and secondary (Detroit 562) cell lines. Shown area percentage of well area covered by cells after treatment in concentration 500 cells/well. (A) displayed as median and interquartile range, * indicate p < 0.05, ** p < 0.001 (B) representative wells, calibration chart denotes 10 mm.

