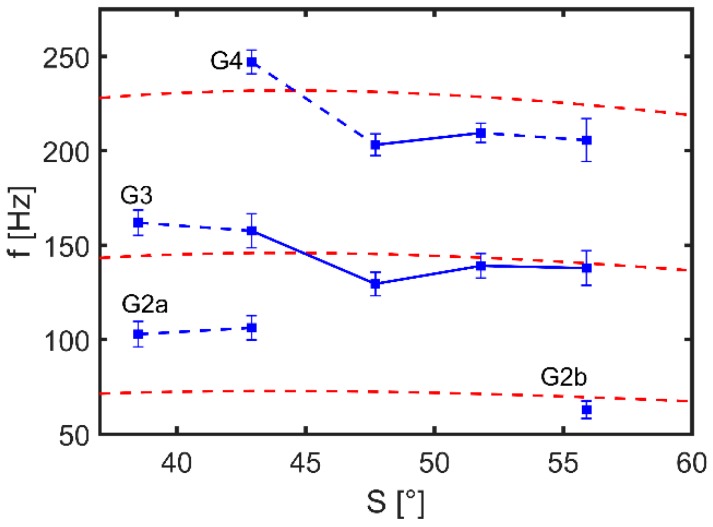
Figure 7.
Experimentally determined resonance frequencies for GB-MBRs for different wall slopes (blue) in comparison to resonance frequencies calculated with Equation 3 (red dashed lines). The resonance frequencies were determined as the positions of local maxima of determined by fitting a Gaussian normal distribution. The obtained standard deviations are given as error bars. Data points were grouped and named (G2 to G4) based on the associated resonance mode. Data points connected only with dashed lines indicate same resonance modes but different flow patterns.

