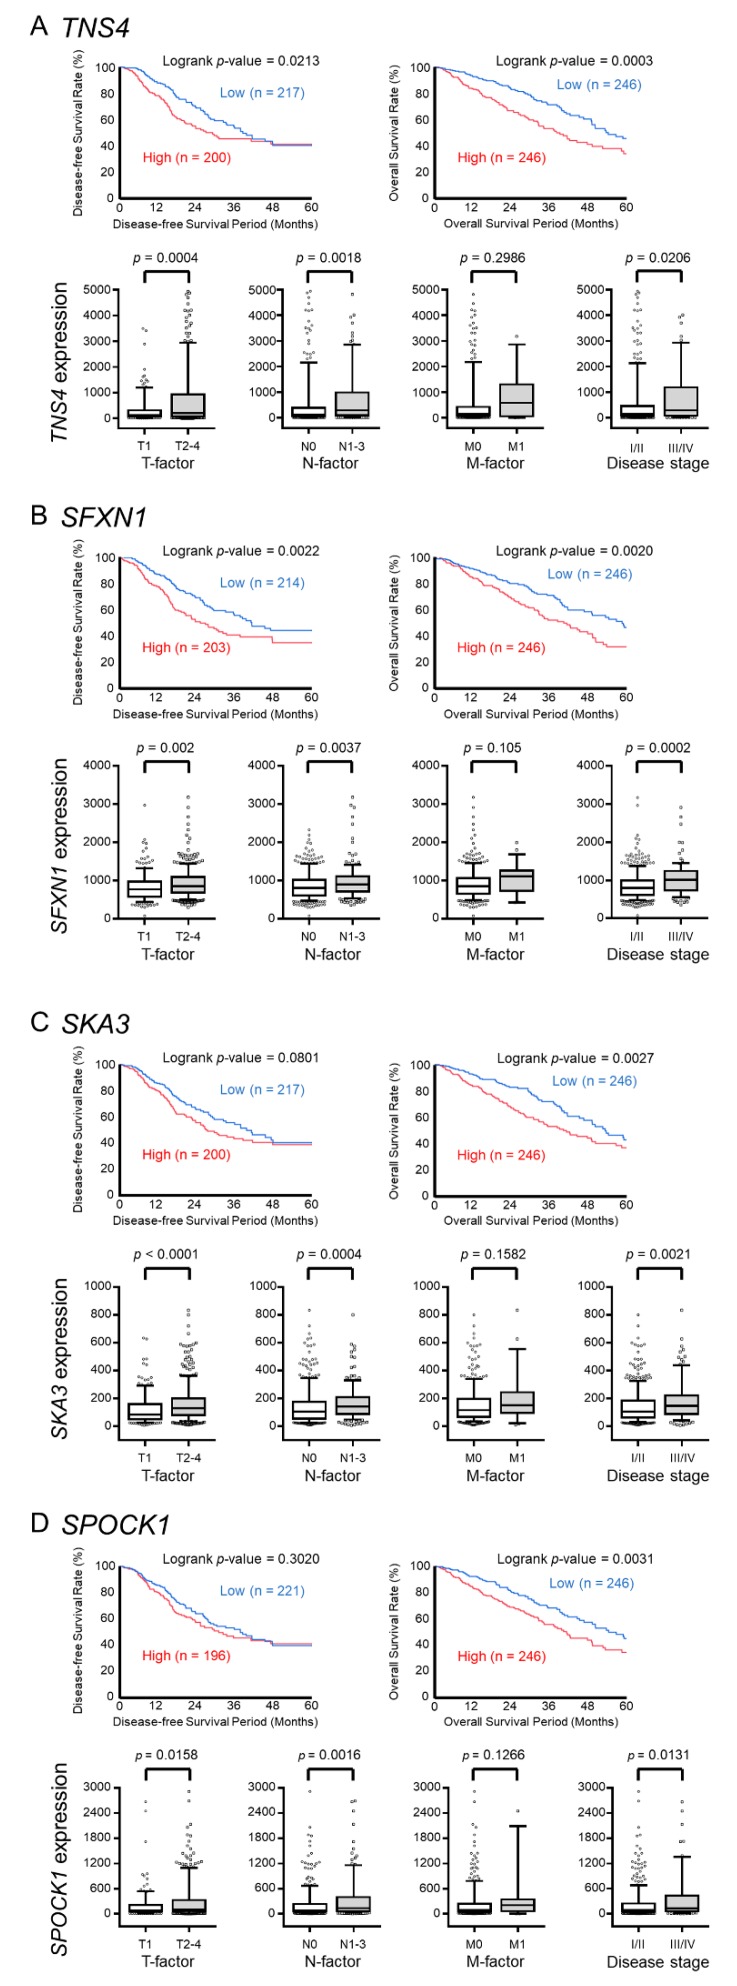
Figure 3.
The relationship between the expression levels of four genes (TNS4, SFXN1, SKA3, and SPOCK1) and clinical significance based on The Cancer Genome Atlas (TCGA) database. (A–D) The Kaplan–Meier disease-free survival curves and overall survival curves, T factor, N factor, M factor, and disease stage of the high- and low-expression groups for four genes (TNS4, SFXN1, SKA3, and SPOCK1).

