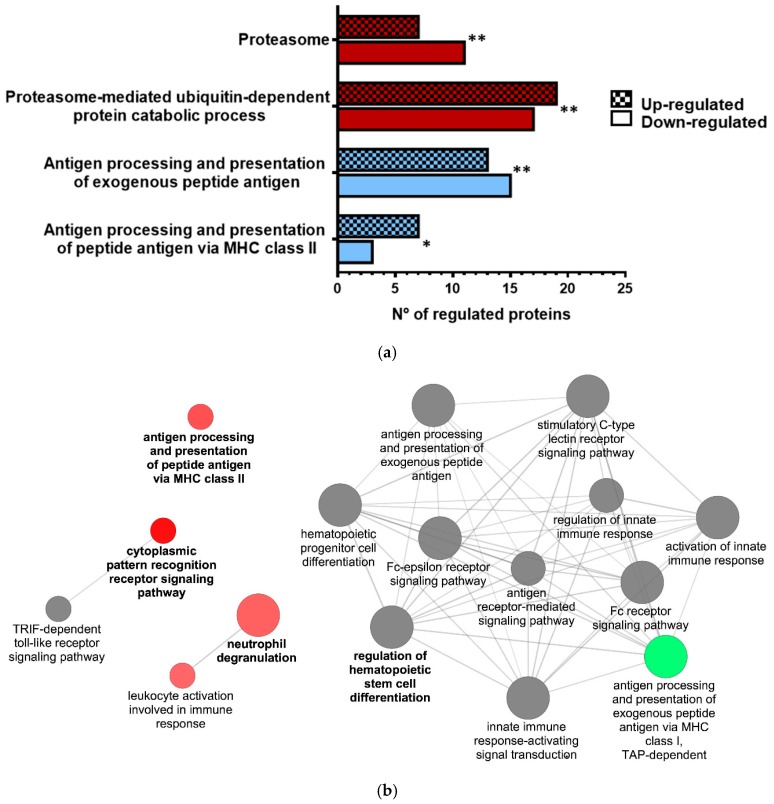
Figure 2.
Proteomic analysis of VHSV-exposed RBCs showed proteasome down-regulation, increased ubiquitination, and regulation of molecules from antigen presentation pathways at 72 hpe. (a) Number of up-regulated and down-regulated proteins related to proteasome (KEGG:03050), proteasome-mediated ubiquitin-dependent protein catabolic process (GO:0043161), antigen-processing and presentation of exogenous peptide antigen (GO:0002478), and antigen processing and presentation of peptide antigen via MHC class II (GO:0002495), as identified by proteomic analysis from ex vivo unexposed and VHSV-exposed rainbow trout RBCs at 72 hpe (Supplementary Table S3). Asterisks denote GO-term significance. (b) Cytoscape pathway network of significantly overrepresented Immune System Process GO terms in VHSV-exposed RBCs at 72 hpe (Supplementary Table S3). Each node represents a GO-term from GO Immune System Process. Node size shows GO-term significance (P value): a smaller P value indicates larger node size. Edge (line) between nodes indicates the presence of common genes: a thicker line implies a larger overlap. The label of the most significant GO-term for each group is highlighted. Up-regulated pathways are coded as red, while down-regulated pathways are coded as green. Pathways with a similar number of up-regulated or down-regulated proteins are coded as gray. Asterisks denote statistical significance.

