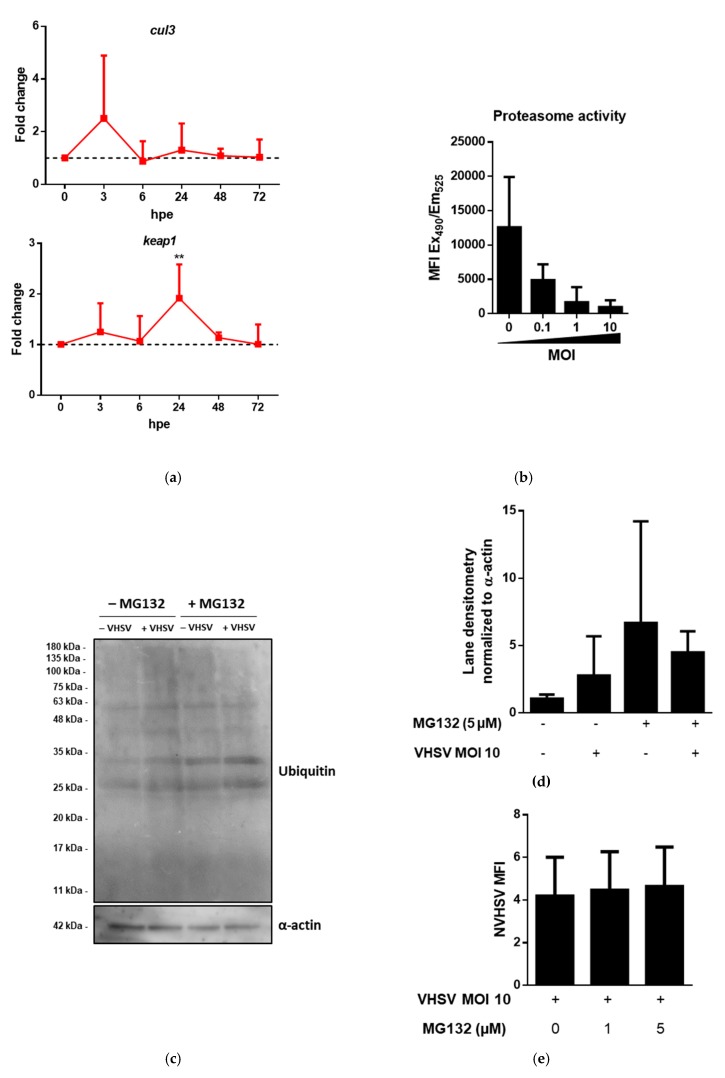
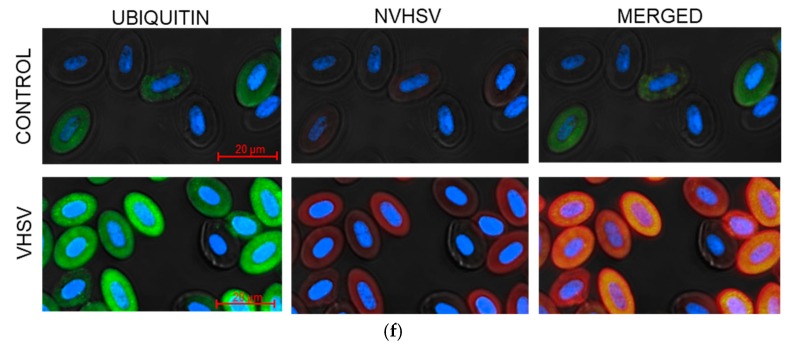
Figure 3.
VHSV induced protein ubiquitination but impaired proteasome degradation in ex vivo VHSV-exposed rainbow trout RBCs. (a) Time-course expression of cul3 and keap1 at 0, 3, 6, 24, 48, and 72 hpe from VHSV-exposed (MOI 1) RBCs. Data represent mean ± SD (n = 5), relative to control cells (black dotted line). A two-way analysis of variance (ANOVA) with Sidak´s multiple comparisons test was performed to test statistical significance between unexposed and VHSV-exposed RBCs at each time point. (b) 20S proteasome activity measured by fluorogenic substrates in RBCs unexposed or exposed to VHSV at the indicated MOI at 24 hpe. Data represent mean ± SD (n = 3). Kruskal-Wallis with Dunn’s multiple comparisons test was performed to test statistical significance between each condition and unexposed RBCs. (c) Western blot of ubiquitin of lysates from unexposed and VHSV-exposed (MOI 10) RBCs at 24 hpe, treated with or without MG132 (5 µM). α-actin was used as endogenous control. Results are representative of 2 independent experiments. (d) Integrated densitometry of ubiquitin lane content from unexposed and VHSV-exposed (MOI 10) RBCs at 24 hpe, treated with or without MG132 (5 µM). Values were normalized to α-actin. Data represent mean ± SD (n = 2). (e) Intracellular quantification by flow cytometry of NVHSV in VHSV-exposed (MOI 10) RBCs at 72 hpe, treated with or without MG132 (1 or 5 µM). Data represent mean ± SD (n = 4). Kruskal-Wallis with Dunn’s multiple comparisons test was performed to test statistical significance between MG132 treated and non-treated RBCs. (f) Representative immunofluorescence of unexposed (control) and VHSV-exposed RBCs at MOI 100 and at 9 hpe stained with anti-ubiquitin (488 stain), 2C9 anti-NVHSV (647 stain), and DAPI for nuclei staining. Asterisks denote statistical significance.


