Figure 4.
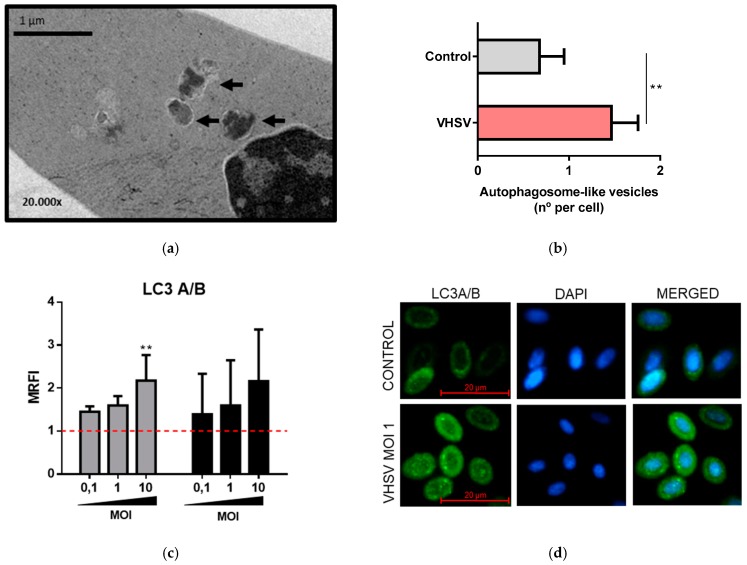
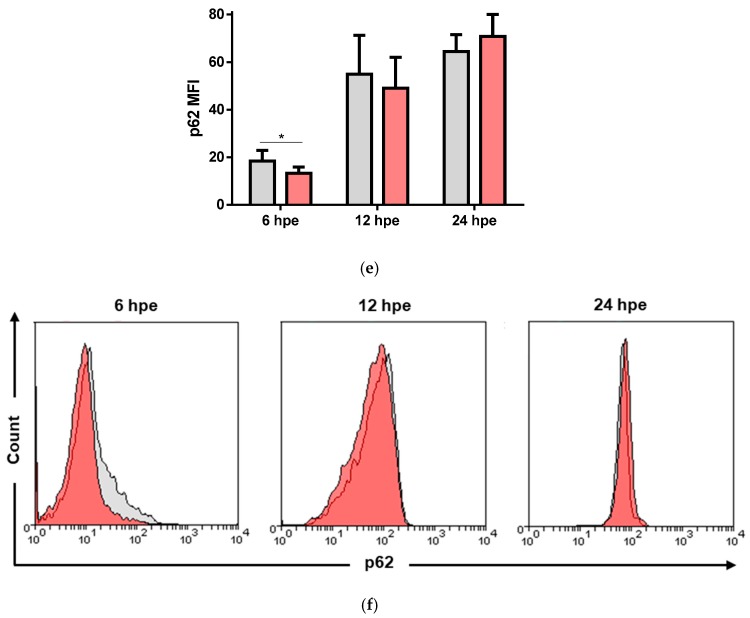
VHSV induced autophagy in ex vivo VHSV-exposed rainbow trout RBCs. (a) Representative transmission electron micrographs of VHSV-exposed RBCs, pointing out autophagosome-like vesicles (black arrows). (b) Count of autophagosome-like vesicles from transmission electron micrographs of unexposed and VHSV-exposed rainbow trout. Data represent the mean ± SD (n = 30). A Mann-Whitney test was performed to test statistical significance. (c) Autophagosome membrane protein LC3 expression levels in VHSV-exposed RBCs at 24 (gray bars) and 72 hpe (black bars) relative to unexposed RBCs (red line) evaluated by flow cytometry (n = 5). Data is represented as MRFI (Mean Relative Fluorescence Intensity) = fluorescence in VHSV-exposed RBCs/fluorescence in non-exposed RBCs. A Kruskal-Wallis with Dunn´s multiple comparisons test was performed to test statistical significance between each condition and unexposed RBCs. (d) Representative immunofluorescence of unexposed (control) and VHSV-exposed RBCs at MOI 1 and at 72 hpe stained with anti-LC3 (488) and DAPI for nuclei staining. (e) Mean fluorescence intensity of p62 protein expression in RBCs unexposed (gray bars) and exposed to VHSV at MOI 10 (red bars) after 6, 12, and 24 hpe. Data represent the mean ± SD (n = 5). A Mann-Whitney test was performed to test statistical significance between unexposed and VHSV-exposed RBCs at each time point. (f) Representative histograms of p62 in RBCs exposed to VHSV (MOI 10) at 6, 12, and 24 hpe: unexposed (gray histogram), VHSV-exposed (red histogram). Asterisks denote statistical significance.


