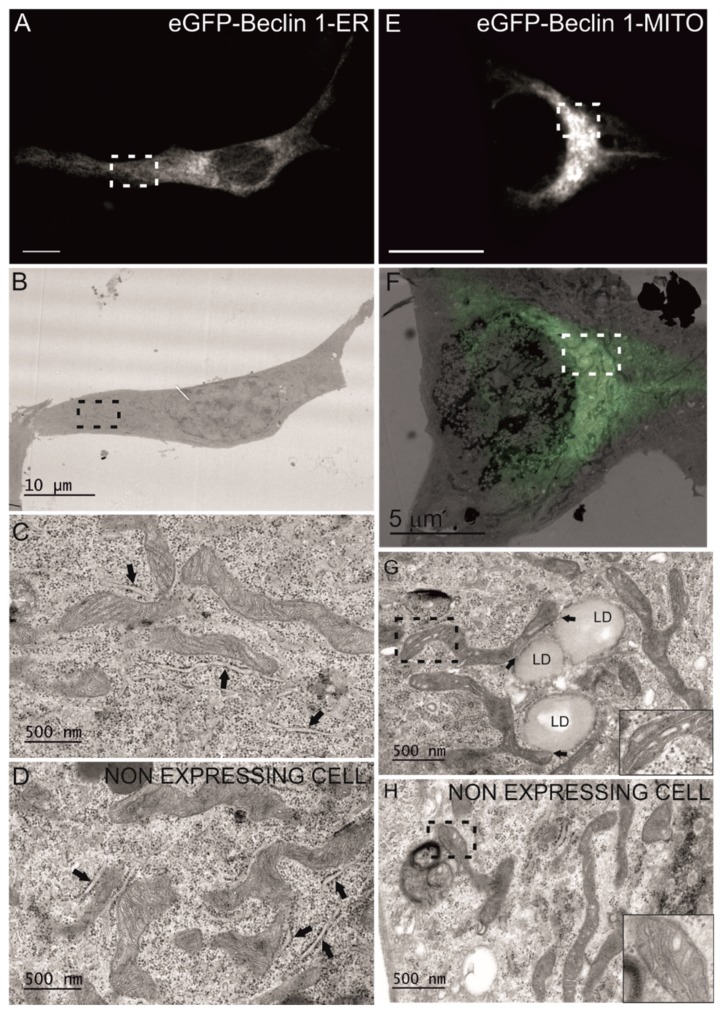
Figure 3.
Electron microscopy analysis of MEF-WT cells expressing eGFP-Beclin 1-ER or eGFP-Beclin 1-MITO. The cells were starved for 1 h in amino-acid-free medium before fixation. (A–D) MEF-WT cells transfected with eGFP-Beclin 1-ER. (A) Confocal image of a cell expressing eGFP-Beclin 1-ER. Scale bar, 10 μm. (B) Electron micrograph of the same cell as in panel A. (C) Higher magnification of the boxed area in panel B, showing normal morphology of rough ER (arrows). (D) Electron micrograph of a non-expressing cell from the same sample, showing the morphology of rough ER (arrows). (E–H) MEF-WT cells transfected with eGFP-Beclin 1-MITO. (E) Confocal image of a MEF-WT cell expressing eGFP-Beclin 1-MITO. Scale bar, 10 μm. (F) Electron micrograph of the same cell as in panel E. (G) Higher magnification of the boxed area in panel F, showing mitochondria and contact sites between lipid droplets (LD) and mitochondria (arrows). (H) Electron micrograph of a non-expressing cell from the same sample, showing the morphology of mitochondria. Inserts in panels G and H show mitochondrial cristae at higher magnification.

