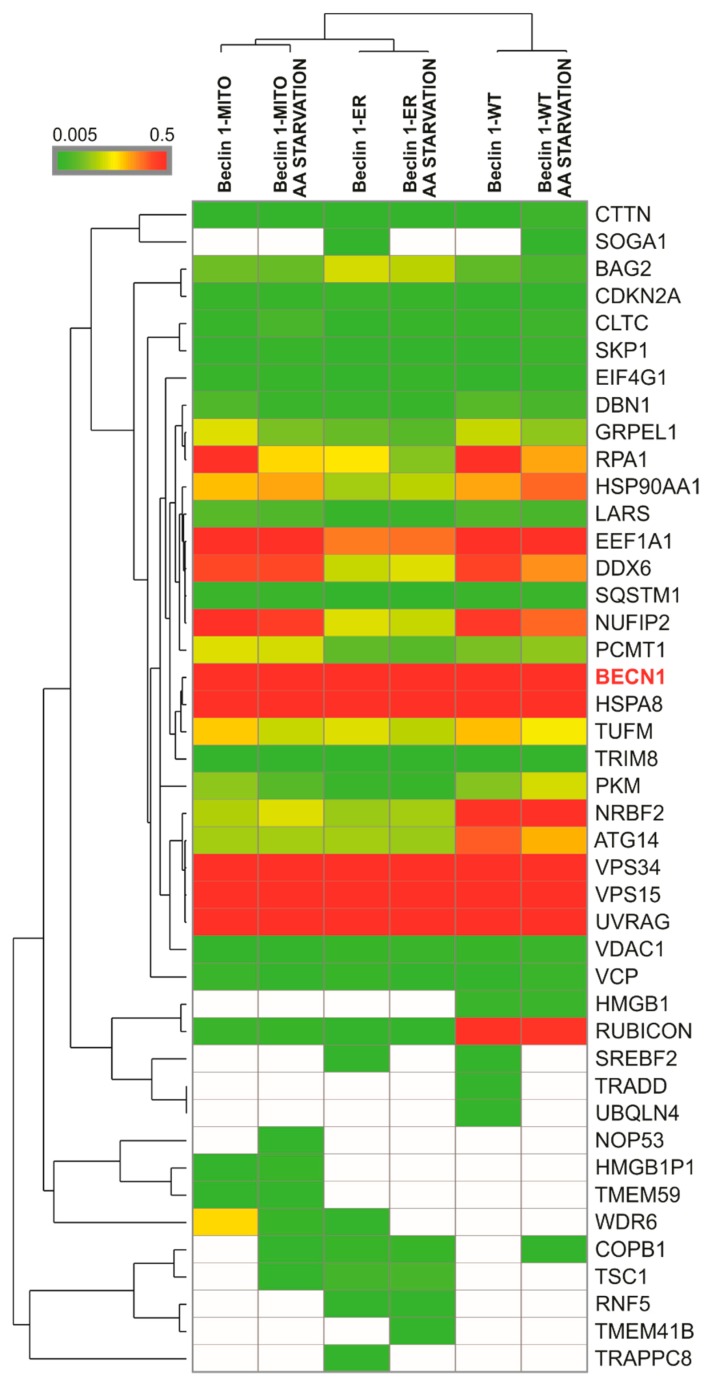
Figure 4.
Heat map with hierarchical clustering of the interactors identified for the Beclin 1 constructs by affinity purification–mass-spectrometry (AP–MS). Stable HEK293 cell lines inducibly expressing Twin-StrepII-HA-tagged Beclin 1 constructs were induced by adding 2 μg/mL tetracycline to the culture medium for 24 h, kept in full medium or starved in amino-acid (AA) free medium for 2 h. The interacting proteins of Beclin 1 were purified using Strep-Tactin beads and the purified proteins were analyzed using mass spectrometry. Heat map shows a summary of the interacting proteins of the Beclin 1 constructs. The colours correspond to protein-relative abundance, using normalized spectral counts (Beclin 1 bait abundance is set to 1). On the bait-normalized spectral count scale, red and shades of red correspond to abundant interactions between Beclin 1 constructs and the hits, while green and shades of green correspond to less abundant interactions. White colour indicates barely detectable or non-detectable interaction. Values are averages of three biological replicates.

