Figure 3.
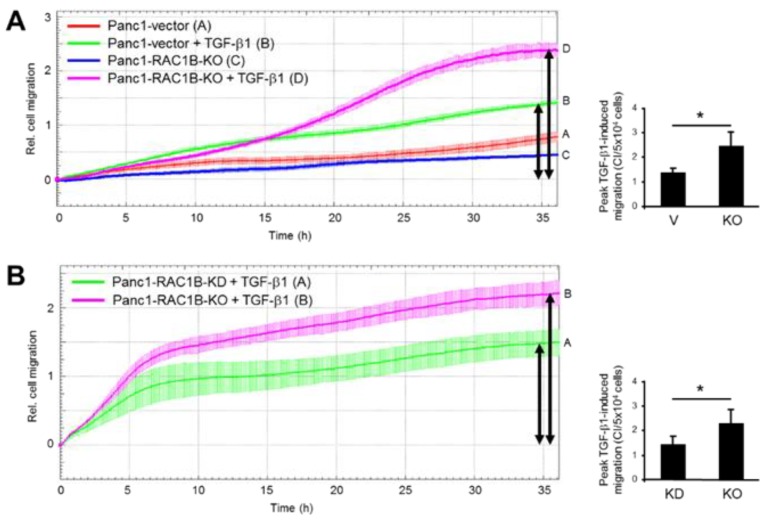
Transforming growth factor (TGF)-β1-induced migration in Panc1-RAC1B-knockout (KO) cells and knockdown (KD) cells. (A) Kinetics of TGF-β1-induced migration of Panc1-RAC1B-KO cells and corresponding vector control cells as measured by real-time cell migration assay. Shown is a representative assay, and data are the mean ± SD of three parallel wells. Differences between Panc1-RAC1B-KO + TGF-β1 (magenta curve, tracing D) and Panc1-vector + TGF-β1 (green curve, tracing B) are significant at 17:45 and all later time points. The bar graph shows quantification of peak TGF-β1-induced migratory activities (indicated by black arrows) of Panc1-vector vs. Panc1-RAC1B-KO cells by depicting the maximal cell index (CI) values (mean ± SD, n = 4). (B) Comparative analysis of TGF-β1-induced migration of Panc1-RAC1B-KD and KO cells by real-time cell migration assay. Panc1-RAC1B-KD were generated by transfecting cells twice with 50 nM of either control siRNA or RAC1B siRNA. Forty-eight hours after the second round of transfection, the cells were subjected together with Panc1-RAC1B-KO cells to real-time cell migration assay in the presence of 5 ng/mL TGF-β1. Data shown are the mean ± SD of three parallel wells and are significantly different at 05:15 and remain so at all later time points. The bar graph shows quantification of peak TGF-β1-induced migratory activities of Panc1-RAC1B-KD and KO cells by depicting their maximal CI values. Data represent the mean ± SD from four (KO) and eight (KD) assays. The asterisk indicates significance (student’s t-test).

