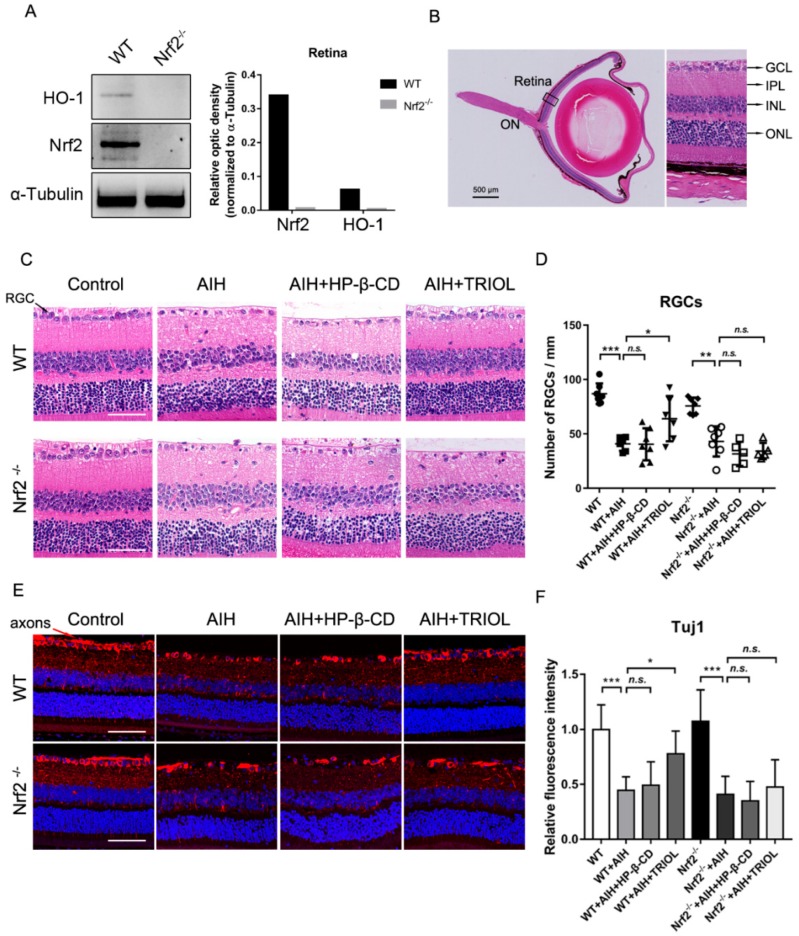
Figure 2.
Nrf2 pathway is involved in the retinal protection of TRIOL. (A) Expression of Nrf2 and its downstream HO-1 were examined by western blot in the lysate of isolated retina from wild-type (wt) and Nrf2−/− mice, shown in the left panel. Quantification of the optic density of Nrf2 and HO-1 in wt and Nrf2−/− mice is shown in the right panel. (B) Schematic structural diagram of mouse retina used for RGC analysis. Black box, retina area to be analyzed; scale bar, 500 μm. (C) Representative images of HE retina staining for evaluation of RGC injury in different groups. RGCs in GCL are marked with black arrows in the left panel; scale bar, 50 μm. (D) Quantification of RGC numbers in the GCL of different groups in C. Calculation of average RGC numbers was described above. N = 5–7 mice for each group. (E) Representative confocal immunofluorescence imaging of RGC axons and dendrites stained by Tuj1 (red). RGC axons are marked with red arrows in the left panel. Nucleus was stained with Hoechst 33342 (blue). Magnification, 200×. (F) Quantification of relative fluorescence intensity of Tuj1 was measured using Nikon NIS-Elements AR software. Statistical analysis of RGC numbers in D and fluorescence intensity in F was performed using one-way ANOVA, followed by Dunnett’s post hoc analysis. N.s., no significance; *, p < 0.05; **, p < 0.01; ***, p < 0.001.

