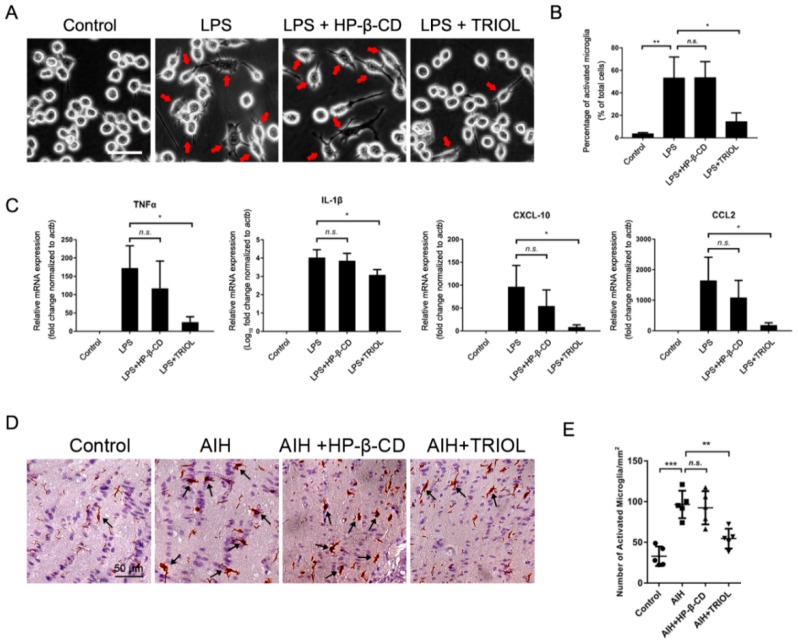
Figure 3.
TRIOL inhibits the inflammatory activation of microglia in vitro and in vivo. (A) Representative phase-contrast morphological images of BV2 microglia treated with or without lipopolysaccharides (LPS) or TRIOL. BV2 microglia were pretreated with 10 μM TRIOL or vehicle (20% HP-β-CD) 30 min before the treatment of 100 ng/mL LPS. Phase-contrast images were captured 12 h after LPS treatment to observe the activated morphology of microglia. Red arrows indicate activated microglia with typical amoeboid-like morphology; scale bar, 20 μm. (B) Number of activated microglia in independent regions of interest (ROI) of different groups were blindly calculated using Image Pro Plus software. (C) MRNA expression of inflammatory cytokines TNF-α and IL-1β, and inflammatory chemokines CXCL-10 and CCL2, was detected using real-time polymerase chain reaction (PCR). N = 3 independent experiments for each group. (D) Representative images of IHC staining by Iba-1 in the optic nerves of wt mice treated with/without TRIOL in the AIH model. Black arrowheads, activated microglia with activated morphology characterized by enlarged cell bodies, more filopodia, and dense Iba1 staining. Quantification of activated microglia shown in E. Statistical analysis of cell numbers in B and E, and relative mRNA expression in C, was performed using one-way ANOVA, followed by Dunnett’s post hoc test. Data are shown in mean ± SD. N.s., no significance; *, p < 0.05; **, p < 0.01; ***, p < 0.001.

