Figure 5.
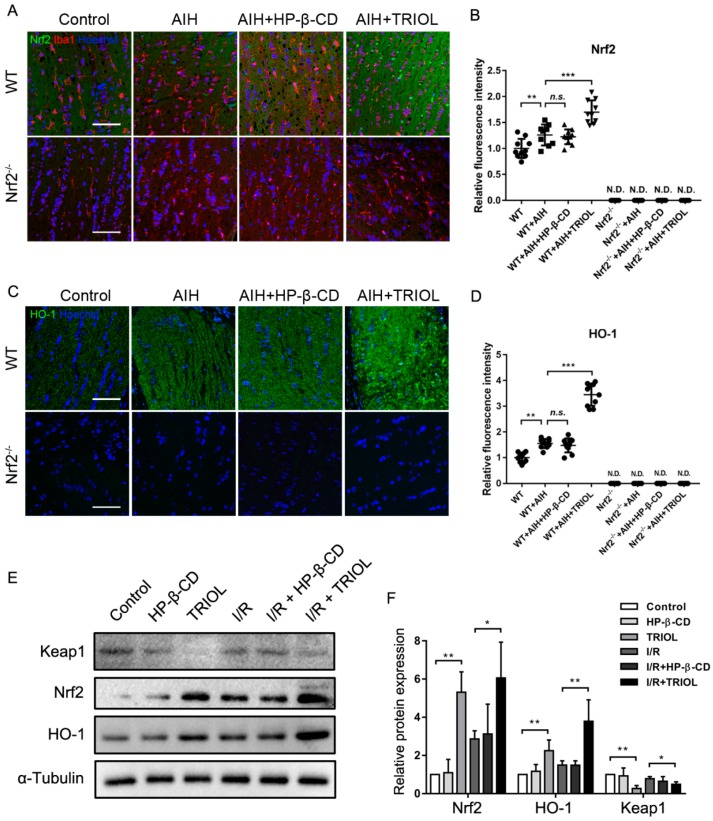
TRIOL upregulates expression of Nrf2 and HO-1 via negative regulation of Keap1. (A) Representative immunofluorescence images of Nrf2 (green) and Iba1 (red) in the optic nerves of different groups. Nucleus was stained with Hoechst 33342 (blue); scale bar, 100 μm. Quantification of relative Nrf2 fluorescence intensity shown in (B); representative confocal images and relative fluorescence intensity of HO-1 shown in (C,D), respectively. (E) Protein expression levels of Nrf2, HO-1, and Keap1 influenced by TRIOL and I/R stimuli were measured by western blot; representative images shown in E. Statistical analysis of relative protein expression measured by the gray-scale of blots shown in F. Statistical analysis of fluorescence intensity in D and E and relative protein expression in F were performed using one-way ANOVA, followed by Dunnett’s post hoc analysis. N.D., not detected; n.s., no significance; *, p < 0.05; **, p < 0.01; ***, p < 0.001.

