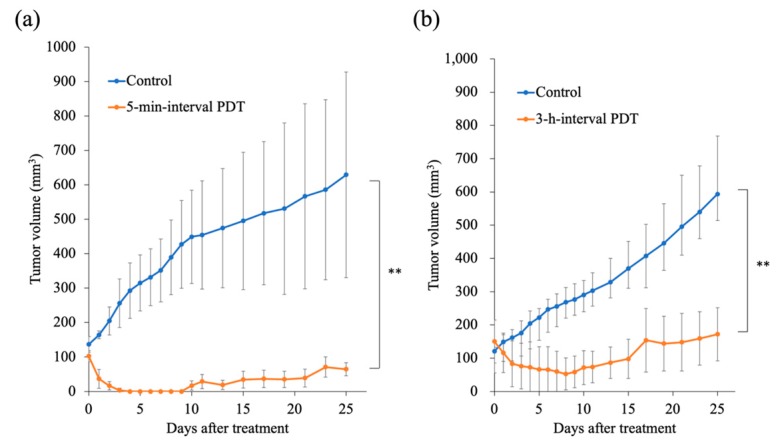
Figure 12.
Changes in tumor volume in response to photodynamic therapy (PDT). (a) The 5-min-interval PDT (n = 4). (b) The 3-h-interval PDT (n = 3). Data were analyzed using Bonferroni’s multiple comparison test. The results are presented as the mean ± standard deviation. Data were analyzed using Bonferroni’s multiple comparison test (** p < 0.01).

