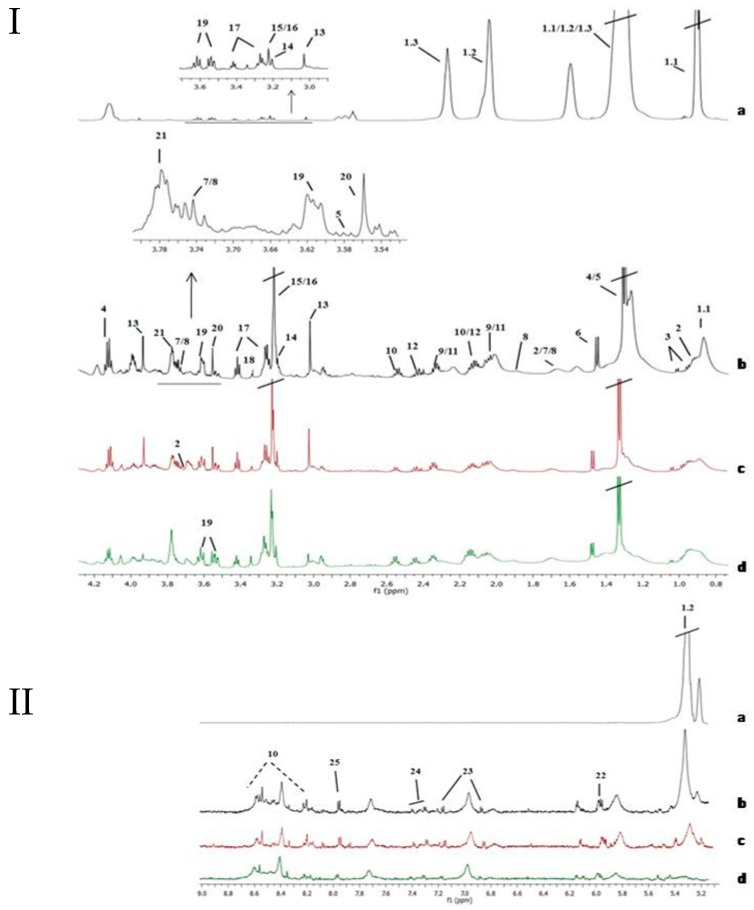
Figure 1.
Assignment of the main signals in 1H NMR spectra of tissue samples (aliphatic region, I, and aromatic region, II). Representative NMR spectra of control non-affected tissue (I and II-a), and various bladder cancer pathologic stages Ta/T1 (I and II-c and I and II-d) and T2 (I and II-b). Vertical scale of all the spectra was kept constant and spectral region of water was removed from the figure. The intensity of peaks in the chemical shift region 5.0—9.0 ppm was scaled equally in all the spectra to show the low abundant metabolites. Metabolic identification: 1.1.Lipid fragment –(n)CH2-CH2-CH2-CH3 (I-a), 1.2.Lipid fragment –CH=CH-CH2-CH=CH-CH2-CH2-(n)CH2 (I and II-a), 1.3.Lipid fragment –(n)CH2-CH2-CH2-COOH (I-a), 2. Leucine, 3. Valine, 4. Lactate, 5. Threonine, 6. Alanine, 7. Lysine, 8. Arginine, 9. Glutamate, 10. Glutathione, 11. Proline, 12. Glutamine, 13. Creatine, 14. Choline, 15. PCholine, 16. GPCholine, 17. Taurine, 18. Methanol, 19. Myo-inositol, 20. Glycine, 21. Glycerol, 22. UDP-sugars, 23. Tyrosine, 24. Phenylalanine, 25. Cytidine diphosphate (CDP).

