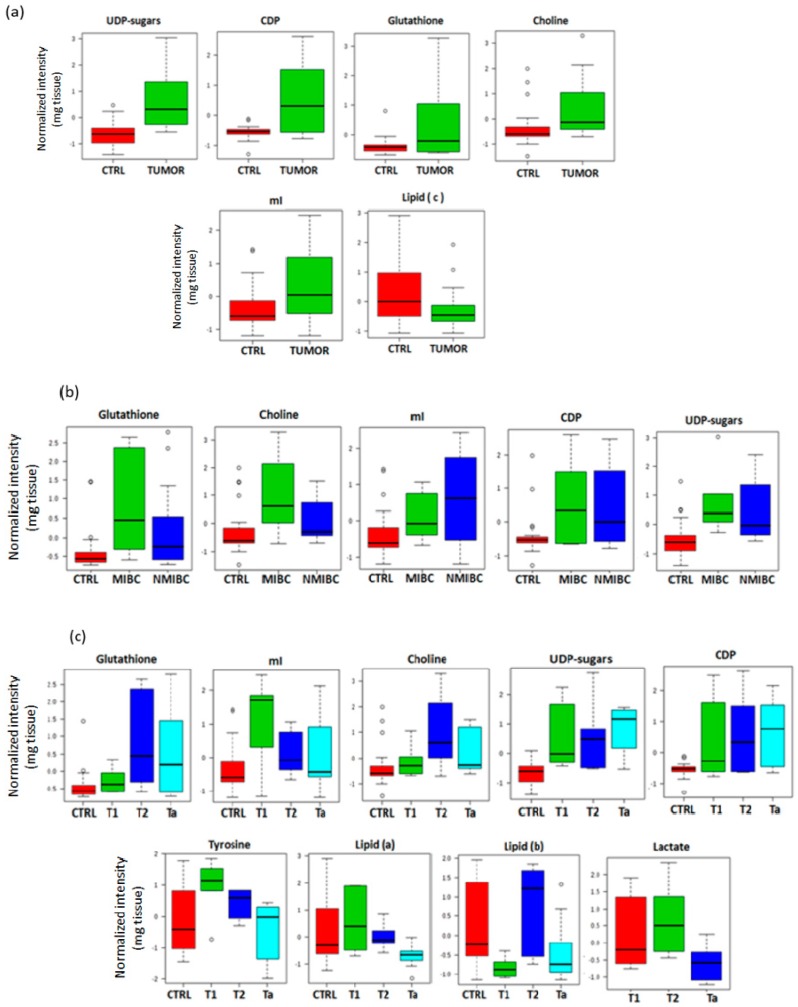
Figure 2.
Box and whisker plots comparing the mean of metabolites detected in tissue. The plots illustrate the discrimination between: (a), tumor and non-tumor tissue samples; (b), controls, non-muscle invasive bladder cancer (NMIBC) and muscle-invasive bladder cancer (MIBC); (c), different stages of BC and control tissue samples.

