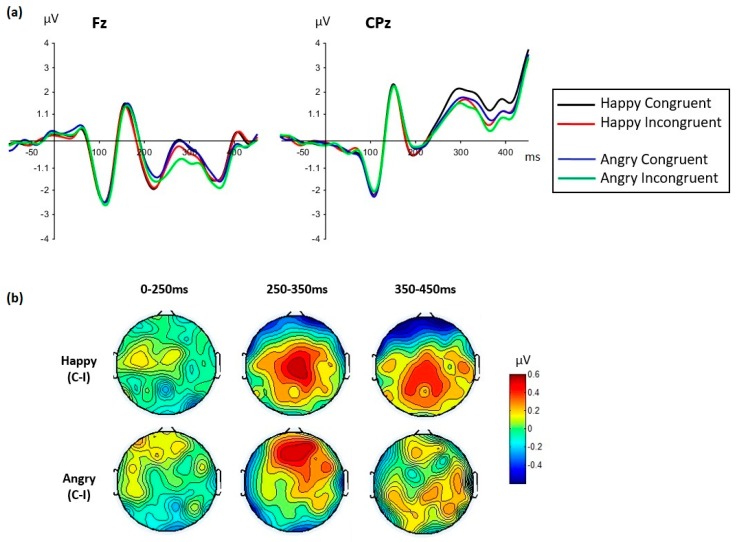
Figure 7.
The effect of congruency varied with the face emotion. (a): group grand averaged waveforms for each face emotion and congruency condition (averaged across tasks) displayed at Fz and CPz sites. (b): topographic maps representing the congruency effect (congruent minus incongruent conditions) are displayed for each face emotion between face onset (0 ms) and 450 ms. The congruency effect displayed a clear centro-parietal distribution for happy face expressions and a clear frontal distribution for angry face expressions, restricted to 250–350 ms.

