Figure 2.

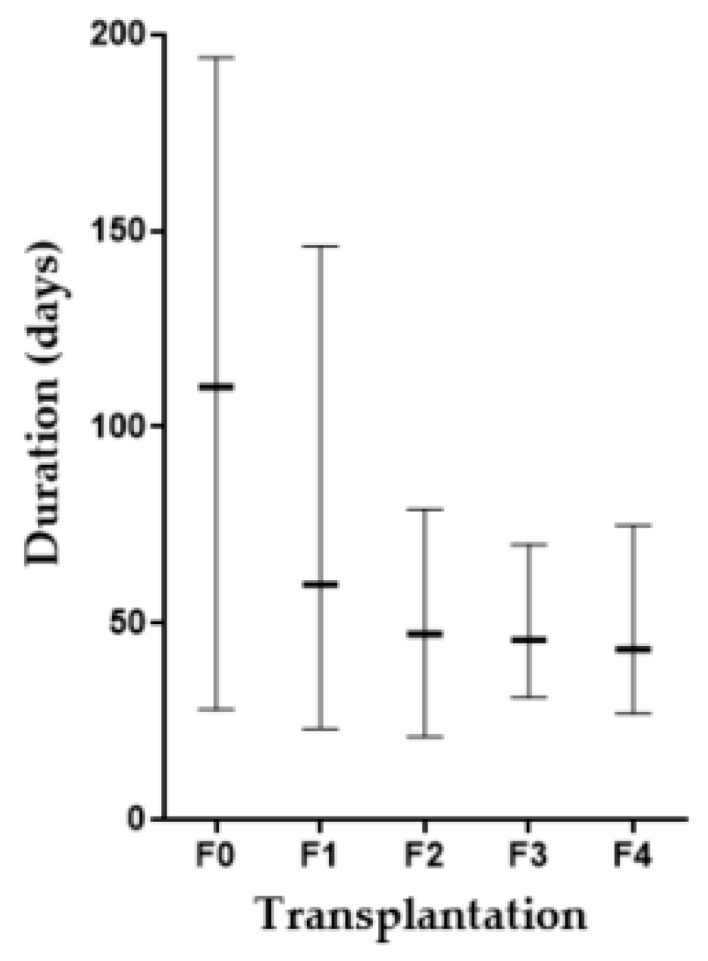
Comparison of PDX growth duration during serial transplantation. Bar indicates the longest to the shortest duration in each generation and - indicates a mean duration.

Comparison of PDX growth duration during serial transplantation. Bar indicates the longest to the shortest duration in each generation and - indicates a mean duration.