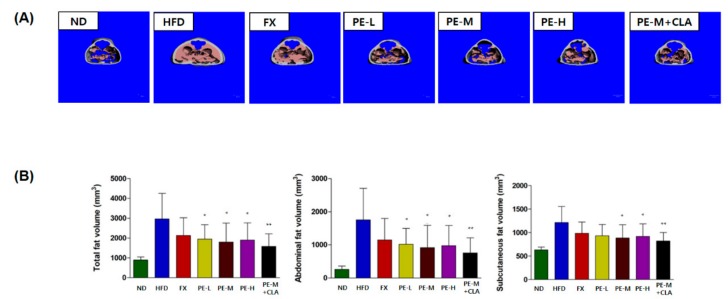
Figure 4.
(A) Micro computed tomography (CT) analysis, (B) total, abdominal, and subcutaneous fat volumes. The groups are abbreviated as: Normal diet (ND); high-fat diet (HFD); fucoxanthin (FX), HFD + FX 0.1 mg/kg/day; PE-L, HFD + PE 0.81 mg/kg/day; PE-M, HFD + PE 1.62 mg/kg/day; PE-H, HFD + PE 3.25 mg/kg/day; PE-M + CLA, HFD + PE 1.62 mg/kg/day plus CLA 410 mg/kg/day. ***/**/* indicate significant differences at p < 0.001/p < 0.01/p < 0.05 levels compared to the HFD group. Values are shown as the mean ± SD (n = 10 per group).

