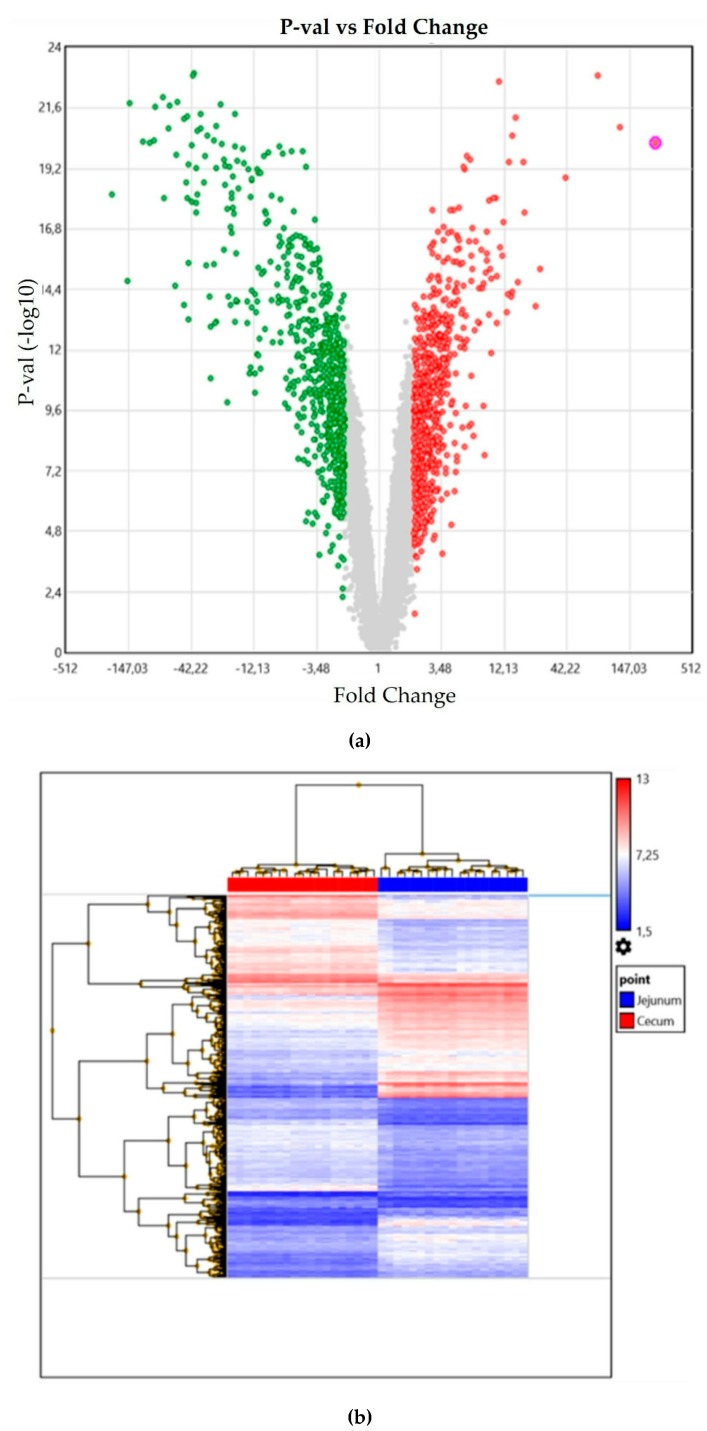
Figure 1.
(a) Volcano diagram (jejunum in green color, cecum in red color), and (b) hierarchical clustering showing the distribution of differentially expressed transcripts (DETs) in the jejunum and cecum of broiler chickens (jejunum in blue color, cecum in red color). Transcripts were considered as DETs when showing a ≥2-fold change ratio (FCR) and a false discovery rate p-value (FDR) < 0.05 between tissues.

