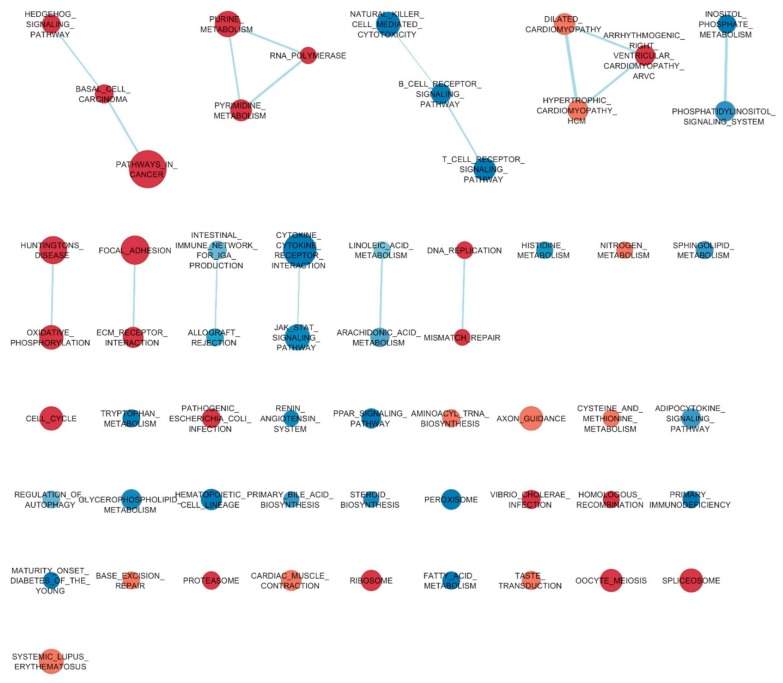
Figure 4.
Enriched gene sets in the jejunum and cecum of broiler chickens at 42 days of age. Nodes represent gene sets enriched in the jejunum (red color) and cecum (blue color). Node size represents the number of genes in each gene set. Node cut-off with an FDR q-value of 0.10. The nodes were joined if the overlap coefficient was ≥0.4.

