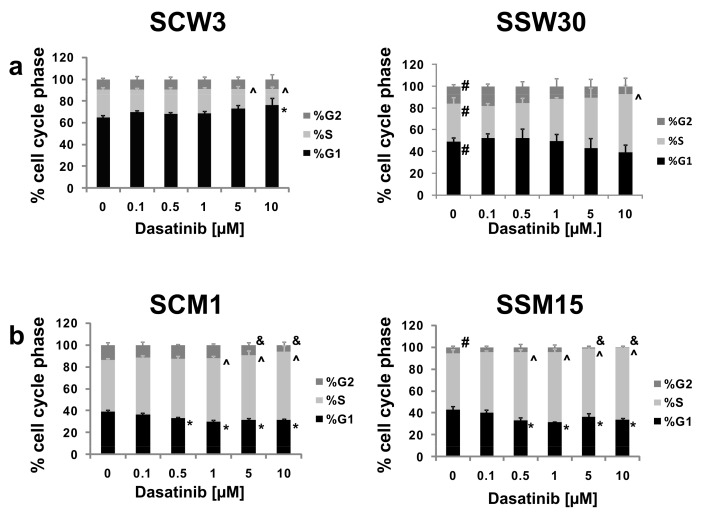
Figure 4.
(a) Cell cycle phase distribution in SCW3 and SSW30 clones. (b) Cell cycle phase distribution in SCM1 and SSM15 clones. The data are presented as the mean ± SD, (n = 3). * Indicates a statistically significant difference at p < 0.05 in %G1 phase between dasatinib and control treatment. ^ Indicates a statistically significant difference in %S phase between dasatinib and control treatment at p < 0.05. & Indicates a statistically significant difference at p < 0.05 in %G2 phase between dasatinib and control treatment. # Indicates a statistically significant difference at p < 0.05 for a given phase between control cell line and SIRT2-deficient cells.

