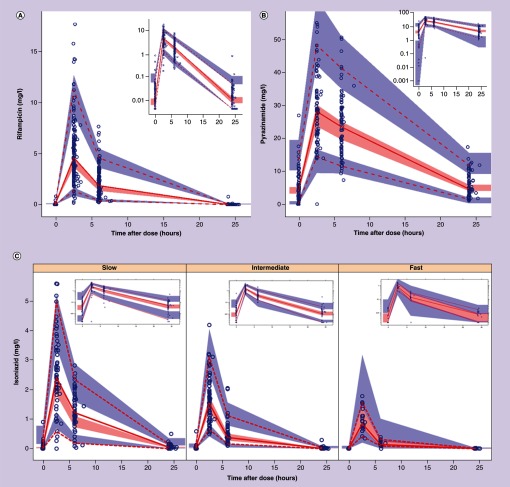
Figure 1. . Visual predictive check for rifampicin, pyrazinamide and isoniazid.
Visual predictive check for pharmacokinetics of rifampicin (A), pyrazinamide (B) and isoniazid stratified by NAT2 acetylator status (C). The dashed and solid lines are the 5th percentile, median and 95th percentile of the observed concentrations, while the shaded regions represent the corresponding 95% CIs for the same percentiles. The subplot in each panel or stratum shows the same VPC with a logarithmic transformation applied to the y-axis.
VPC: Visual predictive check.

