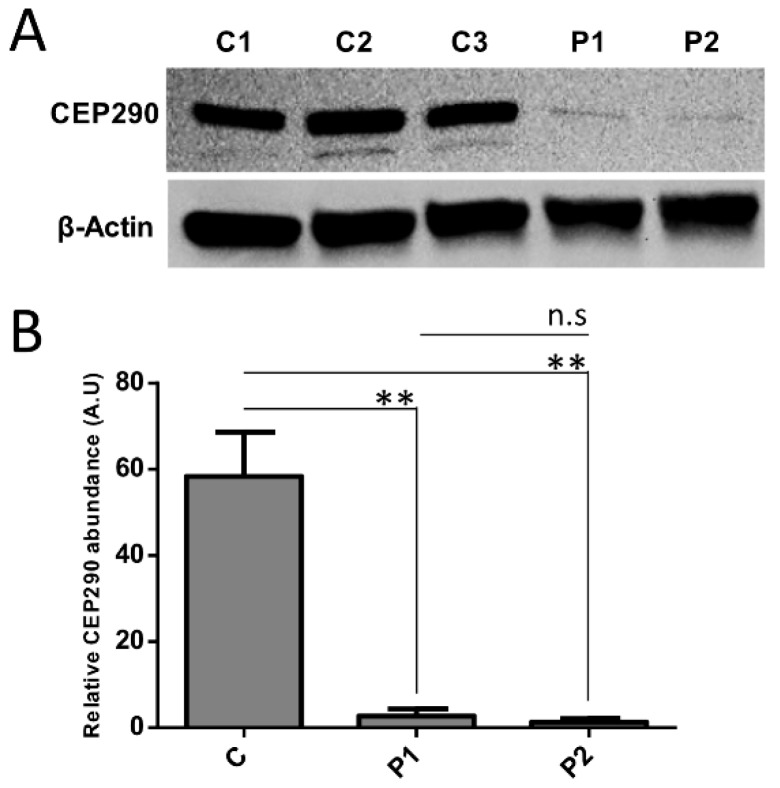
Figure 2.
Effect of the natural exclusion of PTC-encoding exon 36 on CEP290 protein production. (A) Immune detection of the CEP290 and β-Actin in control cell lines (C1–C3) and mutant fibroblasts (P1 and P2). (B) Quantification of CEP290 abundance relative to β-Actin in control (C represents the pooled values of C1–C3) and patient fibroblasts. Bars correspond to the mean value ± SEM from four independent experiments. ** p ≤ 0.01, n.s = not significant.

