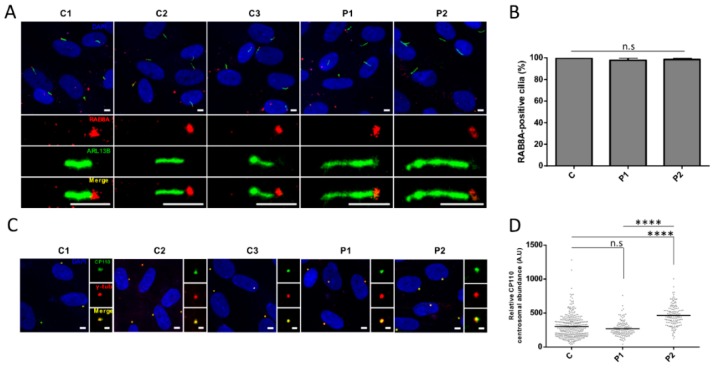
Figure 4.
Localization and abundance of CEP290 centriolar satellite partners. (A) Representative images of RAB8A (red) localization in the cilia from control (C1–C3) and mutant (P1 and P2) fibroblasts induced to quiescence. ARL13B (green) labeling is used to mark the ciliary membrane. Scale bar, 5 µm. (B) Quantification of RAB8A-positive cilia in each cell line (C represents the pooled values of C1–C3). Bars correspond to the mean ± SEM (n ≥ 50 cilia for each group). n.s = not significant. A.U. = arbitrary unit. (C) Representative images of CP110 (green) centrosomal staining in quiescent control and mutant fibroblasts. Centrosomes are stained by γ-tubulin (γ-tub.; red). Image scale bar, 5 µm and inset scale bar, 2 µm. (D) Quantification of CP110 immunofluorescence intensity at centrosomes in quiescent fibroblasts (C represents the pooled values of C1–C3). Each dot depicts the labeling intensity of the protein in individual cells from six microscope fields (recorded automatically). The solid line indicates the mean. **** p ≤ 0.0001, n.s = not significant. A.U. = arbitrary unit.

