Figure 5.
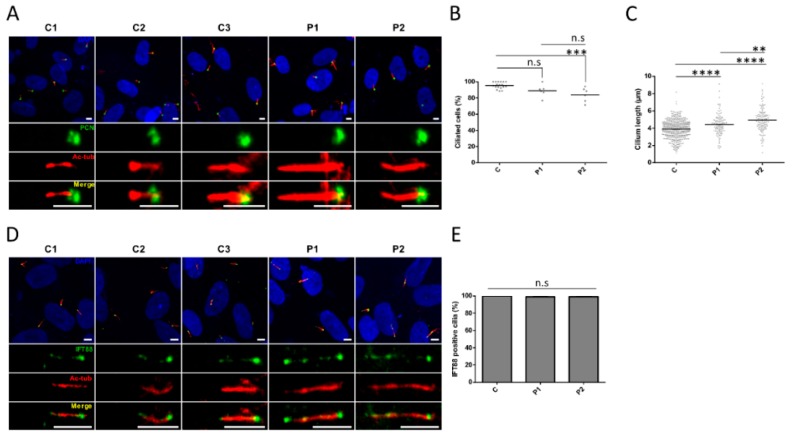
Ciliogenesis and axonemal trafficking. (A) Representative images of cilia in the quiescent control (C1–C3) and mutant (P1 and P2) fibroblasts. The cilium axoneme is labeled with acetylated α-tubulin (Ac-tub; red) and the basal body using pericentrin as a marker (PCN; green). Scale bar, 5 µm. (B) Percentage of ciliated cells and (C) length of cilia axonemes in control and patient fibroblasts. A minimum of 90 ciliated cells were considered for each cell lines. (D) Representative images of IFT88 (green) localization along the cilium in quiescent control (C1–C3) and mutant (P1 and P2) fibroblasts. Acetylated α-tubulin (Ac-tub; red) staining was used as a marker of the ciliary axoneme. Scale bar, 5 µm. (E) Quantification of IFT88-positive cilia. Bars represent the mean ± SEM (n ≥ 80 cilia for each group). C regroups the values of C1–C3. ** p ≤ 0.01, *** p ≤ 0.001, **** p ≤ 0.0001, n.s = not significant.

