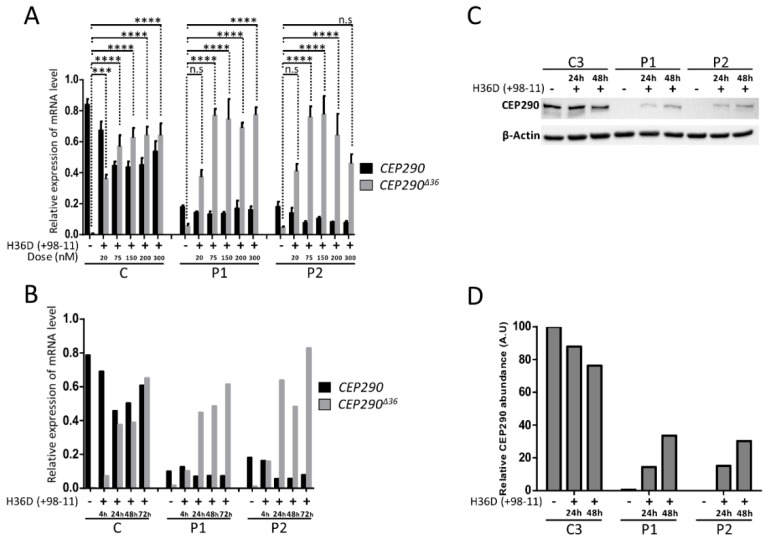
Figure 8.
Optimization of transfection conditions. (A) RT-qPCR analysis of reverse transcribed CEP290 mRNA extracted from control (C1–C3) and patient (P1 and P2) fibroblasts untreated or after transfection of increasing doses (20 nM to 300 nM) of H36D oligonucleotide. The graph shows the mean amounts (±SEM) of full-length (CEP290; black bars) and exon 36-skipped transcripts (CEP290∆36; grey bars) from three independent experiments. C regroups the values obtained for C1–C3. *** p ≤ 0.001, **** p ≤ 0.0001, n.s., not significant. (B) RT-qPCR analysis of reverse transcribed CEP290 mRNA extracted from control (C1–C3) and patient (P1 and P2) fibroblasts untreated or treated during increasing times of treatment (4 h to 72 h) with 75nM of H36D oligonucleotide. The graph shows the amounts of full-length (CEP290; black bars) and exon 36-skipped transcripts (CEP290∆36; grey bars). C corresponds to C1–C3 pooled values. (C) CEP290 protein analysis in control (C3) and mutant (P1 and P2) cell lines untreated or treated with 75nM of H36D during 24 h or 48 h. (D) Relative quantification of CEP290 protein abundance depending on treatment time. β-Actin was used for normalization.

