Figure 1.
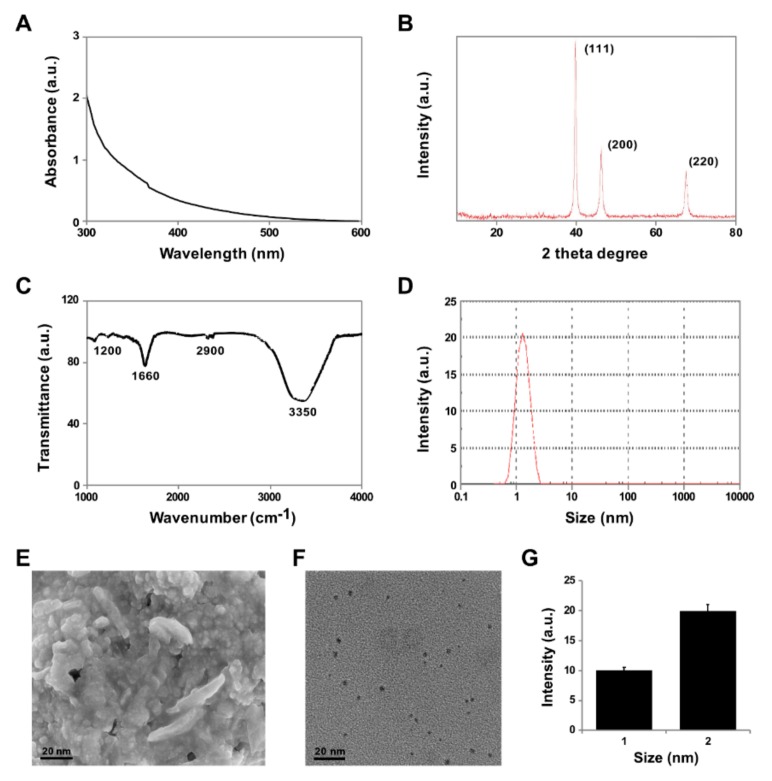
Synthesis and characterization of platinum nanoparticles (PtNPs). (A) Absorption spectra of apigenin-mediated synthesis of PtNPs. (B) X-ray diffraction patterns of PtNPs. (C) FTIR spectra of PtNPs. (D) Size distribution analysis of PtNPs using DLS. (E) SEM micrograph images of PtNPs. (F) TEM images of PtNPs. (G) Histograms showing particle size distribution. At least three independent experiments were performed for each sample and reproducible results were obtained. The data represent the results of a representative experiment.

