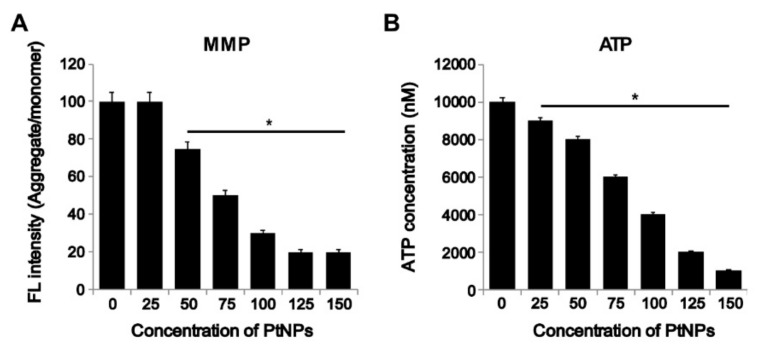
Figure 7.
PtNPs decreased mitochondrial membrane potential (MMP) and ATP content. (A) THP-1 cells were treated with PtNPs (25–150 µg/mL) for 24 h, and the mitochondrial membrane potential (MMP) was determined using the cationic fluorescent indicator JC-1. (B) THP-1 cells were treated with PtNPs (25–150 µg/mL) for 24 h and the intracellular ATP content was determined according to the manufacturer’s instructions (Catalogue Number MAK135; Sigma-Aldrich). The results are expressed as the mean ± standard deviation of three independent experiments. The treated groups showed statistically significant differences from the control group per the Student’s t-test (* p < 0.05).

