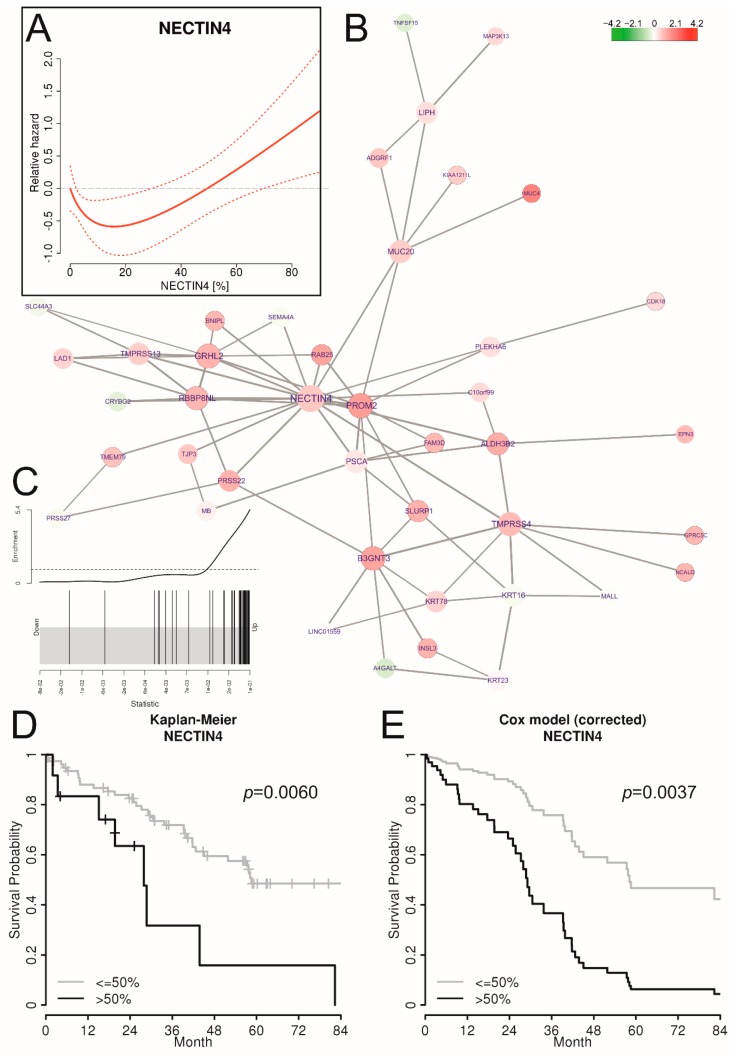
Figure 4.
Validation of the impact of Nectin 4 protein expression on overall survival and correlation to Nectin 4 cluster (c1_143) expression. (A) Non-linear correlation of percentage Nectin 4 positive cells (x-axis) with relative hazard for death (y-axis) corrected for age, FIGO stage, and residual tumor mass, as estimated by fractional polynomials Cox regression. (B) Correlations of gene expressions of the c1_143 cluster with NECTIN4 as hub-gene with Nectin 4 protein abundances (Nectin 4 score) in corresponding tumor tissues (colors represent log2 fold-changes, FCs). (C) Barcode enrichment plot showing the ranked statistics of log2 FCs from subfigure B. (D) Kaplan-Meier estimate for overall survival dichotomizing Nectin 4 percentages following the cutoff determined in subfigure A (>50% versus ≤50%). (E) Survival curves of the multiple COX regression model (cf. Table 3), dichotomized as in subfigure D. As these survival curves represent a multiple Cox model, no censored patients are indicated.

