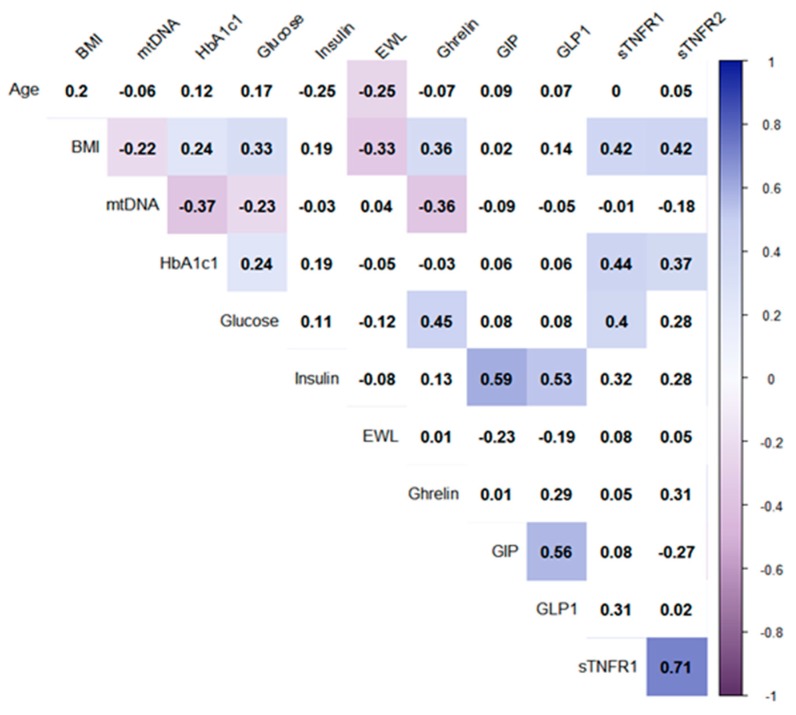
Figure 1.
Correlations of all studied parameters (before and after surgeries) in all patients. Note: The analysis was performed using Pearson’s test correlation. Only significant correlations (p < 0.05) are marked by color. Intensities of the colors mark Pearson’ coefficient of correlations (from −1 to 1). Correlation matrix is quantitatively similar if we analyze whole dataset including both controls.

