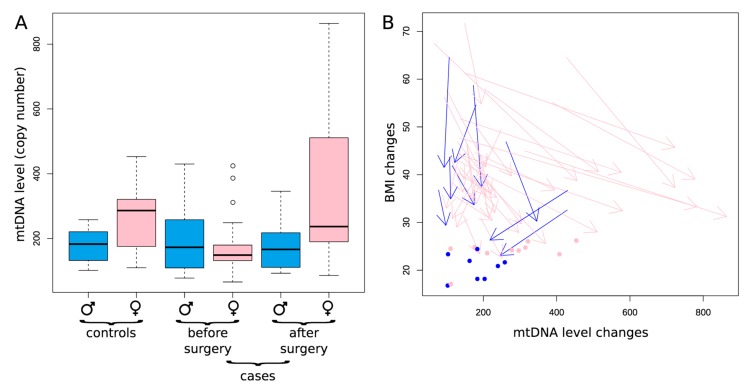
Figure 2.
The number of copies of mtDNA in blood cells in all patients according to gender. Note: (A) Gender-specific variation in mtDNA level between controls and in patients before and after both bariatric operations, regardless of the type of operations. The blue boxes correspond to men, the pink ones—women; (B) The dynamics of changes in BMI and mtDNA level (the number of copies) is depicted for each patient by an arrow: start of each arrow corresponds to the conditions before the surgery and the end of each arrow–conditions after the surgery: blue—men, pink—women, arrows– cases, dots–controls.

