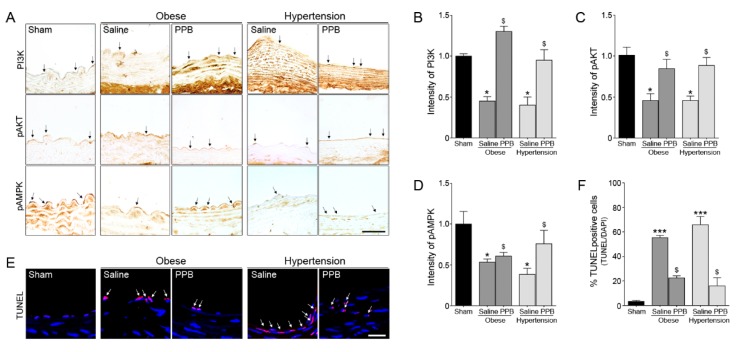
Figure 5.
Inhibitory effects of the PPB isolated from ECE on EC dysfunction in diet-induced mouse models of obese and hypertension. (A) Light microscopic images showing the EC survival related molecules, such as PI3K, pAKT and pAMPK (brown, arrow). (B–D) Quantitative graphs show intensity from representative images (dark gray bar, obese mouse model; gray bar, hypertension mouse model). Scale bar = 10 μm. (E,F) TUNEL positive cells (red, arrow) indicate apoptotic cells, and nuclei stained DAPI (blue). Quantitative graphs show percentage of TUNEL positive cells from representative images. Scale bar = 50 μm. *, P < 0.05 and ***, P < 0.001 vs. the sham group; $, P < 0.05 vs. Obese/Saline or Hypertension/Saline group. PPB, pyrogallol-phloroglucinol-6,6-bieckol.

