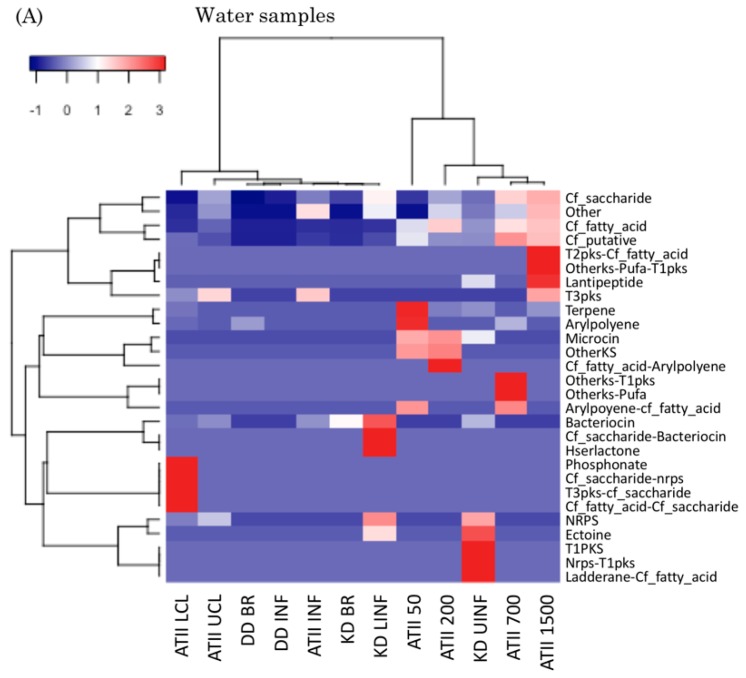
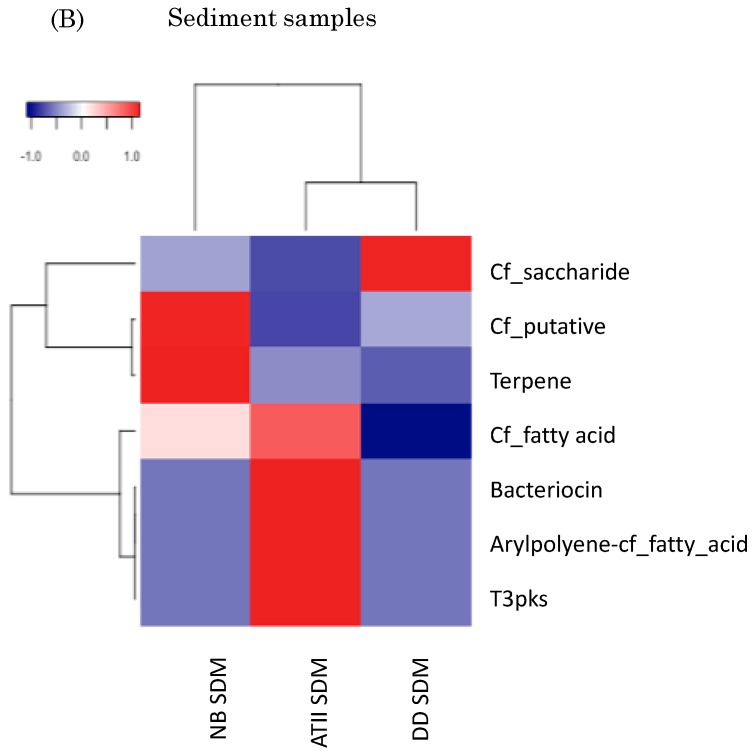
Figure 4.
Heat maps representing hierarchical classification of the SMGCs detected in Red Sea brine pool metagenomes. (A) Heat map for the Red Sea water samples SMGCs. (B) Heat map for the Red Sea sediment samples SMGCs. Hierarchical clustering was based on the relative abundance of normalized numbers of SMGCs detected at each site.


