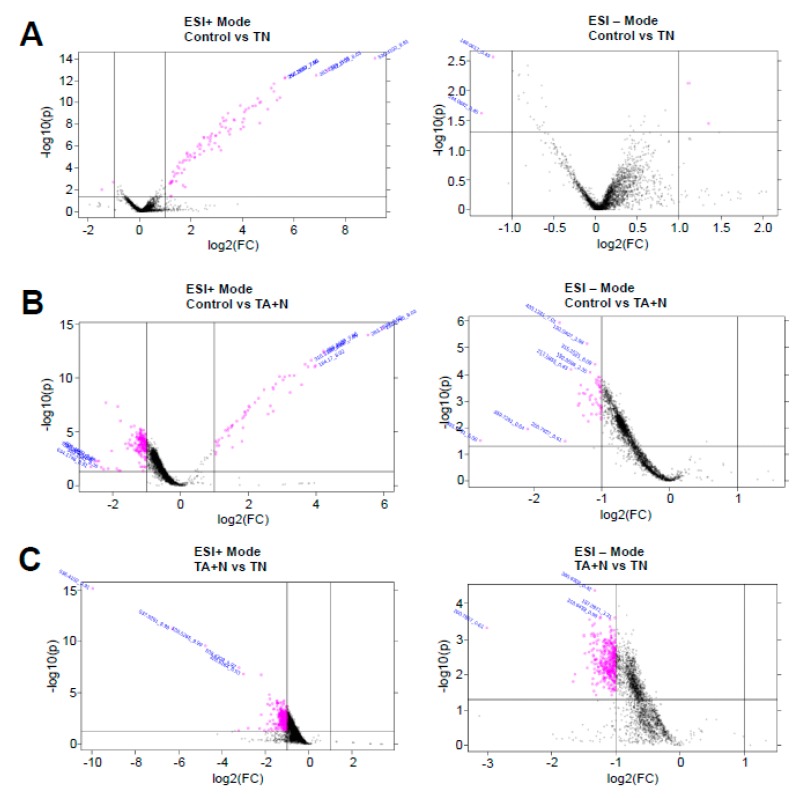
Figure 2.
Volcano plots. (A) ESI+ and − modes of control vs vitamin E nicotinate (TN); (B) ESI+ and − modes of control vs. vitamin E acetate + niacin (TA + N); (C) ESI+ and − modes of TN vs. TA + N. Human pulmonary artery smooth muscle cells were treated with either TN (100 µM) or with TA (100 µM) plus niacin (100 µM) (TA + N) for 10 min. Samples were subjected to metabolomics analysis (n = 9). The dot plots represent fold changes (FC) on the x-axis and statistical significance is shown by the p-value (p) on the y-axis. Pink dots represent values with p ≤ 0.05 and a multiplicative change of greater than two-fold.

